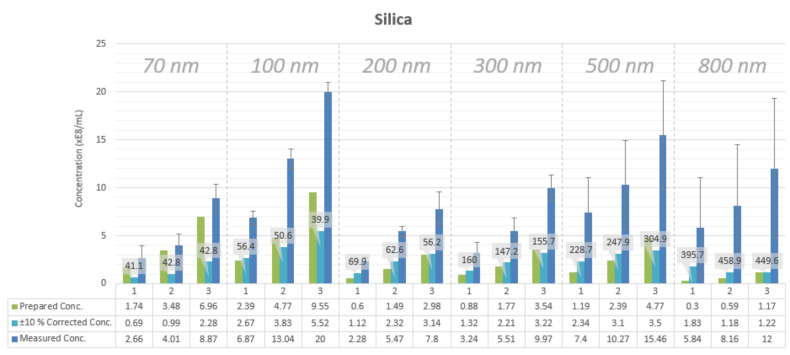
Figure 3.
Concentration measurements of three prepared concentrations for different particle sizes for silica nanoparticles as measured by NTA. Each sample of nanoparticles is measured in triplicate by three different researchers on three separate occasions, adding up to nine measurements for each sample. The corrected concentrations represent a cut percentage of the measurement histograms. More on this can be found in Section 2.3. FWHM values for sample histograms are shown in nm in data labels.

