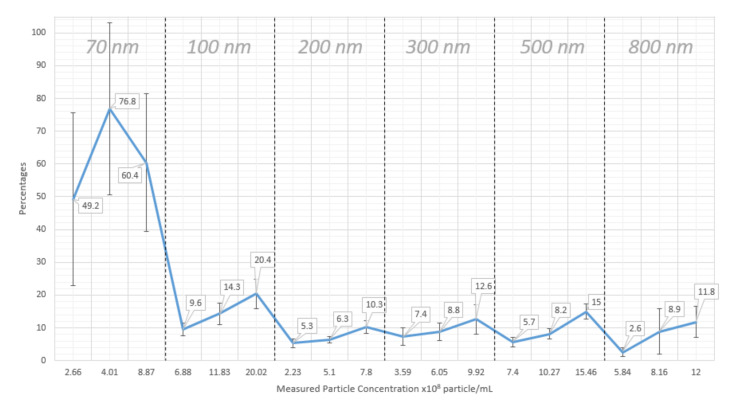
Figure 6.
Correction percentages to match prepared concentrations for different silica nanoparticle sizes and for three different concentrations with correction percentages in data labels for each point. Each point in this graph is the average correction percentage for nine separate measurements of the same sample.

