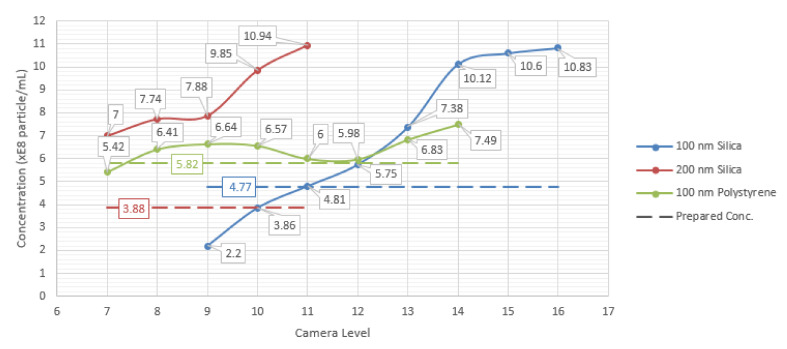
Figure 7.
Effect of changing the camera levels on the measured concentration for 100 nm silica, 200 nm silica and 100 nm polystyrene samples. Prepared concentration values for each of the samples are shown as dotted lines. The last point in each sample line corresponds to the recommended camera level by the software for the measured sample.

