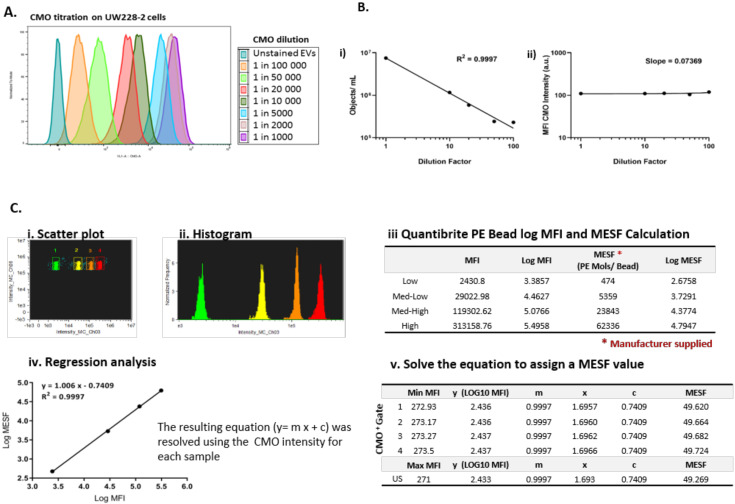
Figure 2.
Cell Mask Orange can label EVs to enable standardisation across experiments. (A) Cell Mask Orange (CMO) labelling was optimised by titration using parent cells. Serial dilutions from 1 in 1000–100,000 were used to label parent UW228-2 cells and analysed by flow cytometry. A clear relationship between CMO concentration and fluorescence intensity is shown. (B) ISX: Objects/mL reduce with increased sample dilution (i) whilst CMO intensity remains constant (ii). Sample dilution was used to validate EV staining protocol. Using a CMO dilution of 1 in 2000 (2.5 µg/mL), the Imagestream acquired fewer CMO positive objects per ml with increasing dilution of CMO labelled EVs (i), whilst the CMO fluorescence intensity in channel 03 was maintained (ii). (C) Quantibrite PE Beads were run at the time of each experiment and used to assign molecules of equivalent soluble fluorochrome (MESF) values to the CMO intensity of labelled EVs. (Representative example from a single experiment shown) Quantibrite PE beads were acquired at the time of each experiment to assign MESF value. Quantibrite PE beads were separated on a bivariate plot of intensity against side scatter (i). The fluorescence intensity of each bead set was gated on the histogram (ii) and assigned a MESF value according to the number of PE molecules per bead as provided by the manufacturer (iii). Log MFI against Log MESF provided a standard curve for each acquisition (iv). Regression analysis was used to extrapolate the equivalent MESF value for CMO intensity for unstained and labelled samples (v) which enabled lower threshold for CMO intensity to be set to distinguish between unstained and CMO labelled EVs. Representative experiment shown. MESF 50 was subsequently used to set the lower CMO+ threshold to standardise across experiments. (D) CMO labelling was diminished following the addition of detergent. CMO positive (CMO+) EVs could be distinguished from unstained EVs by ISX (i). Treatment of the same sample with Triton-X 100 diminished the CMO labelling (ii). Exported .fcs files from the same acquisition were overlaid using FlowJo 10.6 (Ashland). The fully stained sample (orange) shows increased fluorescence intensity in channel 3. The same sample post Triton–X treatment (blue) showed a reduction in fluorescence intensity to a similar level of the unstained sample (grey).


