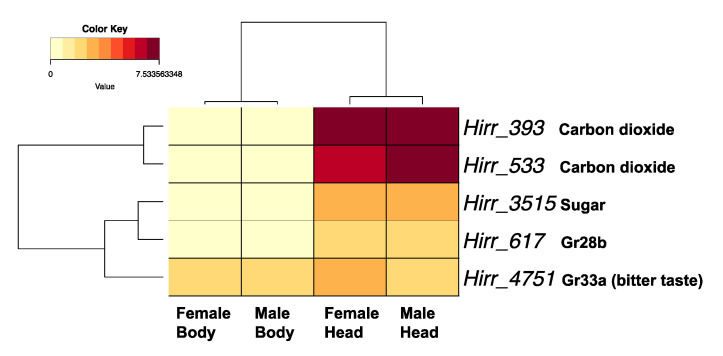
Figure 9.
Heat map and hierarchical clustering dendrogram of Haematobia irritans candidate GR transcripts in female and male head appendages (Head) and headless bodies (Body). Log-transformed TPM values were used to construct the heat map. These five represent the most abundantly expressed transcripts encoding GRs. Dendrogram reflects transcripts with similar expression patterns, identified by hierarchical clustering applied to expression values (rows) and dataset categories (columns).

