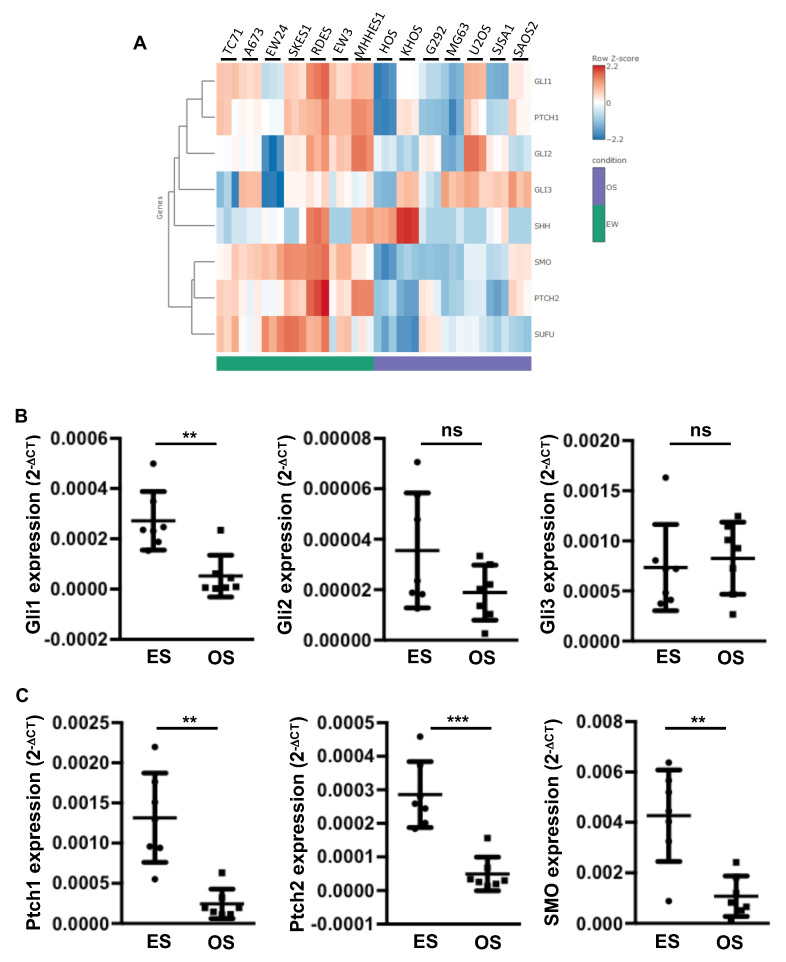
Figure 1.
Increased expression of the Sonic hedgehog (SHH) cascade compounds in Ewing’s sarcoma (ES) cell lines. (A) heatmap showing color-coded expression of SHH cascade compounds in seven osteosarcoma (OS) cells and seven ES cells following bioinformatics analysis of RNAseq data. High expression (red); low expression (blue). (B,C) Gli1, Gli2, Gli3 (B) and Patch (Ptch)1, Ptch2 and Smoothened (SMO) (C) mRNA steady-state levels were quantified by RT-qPCR analysis of seven OS cells and seven ES cells (each point represents the value of one cell line, bars indicate means ± SD of 3 independent experiments, each performed in triplicate, ** p < 0.005; *** p < 0.001).

