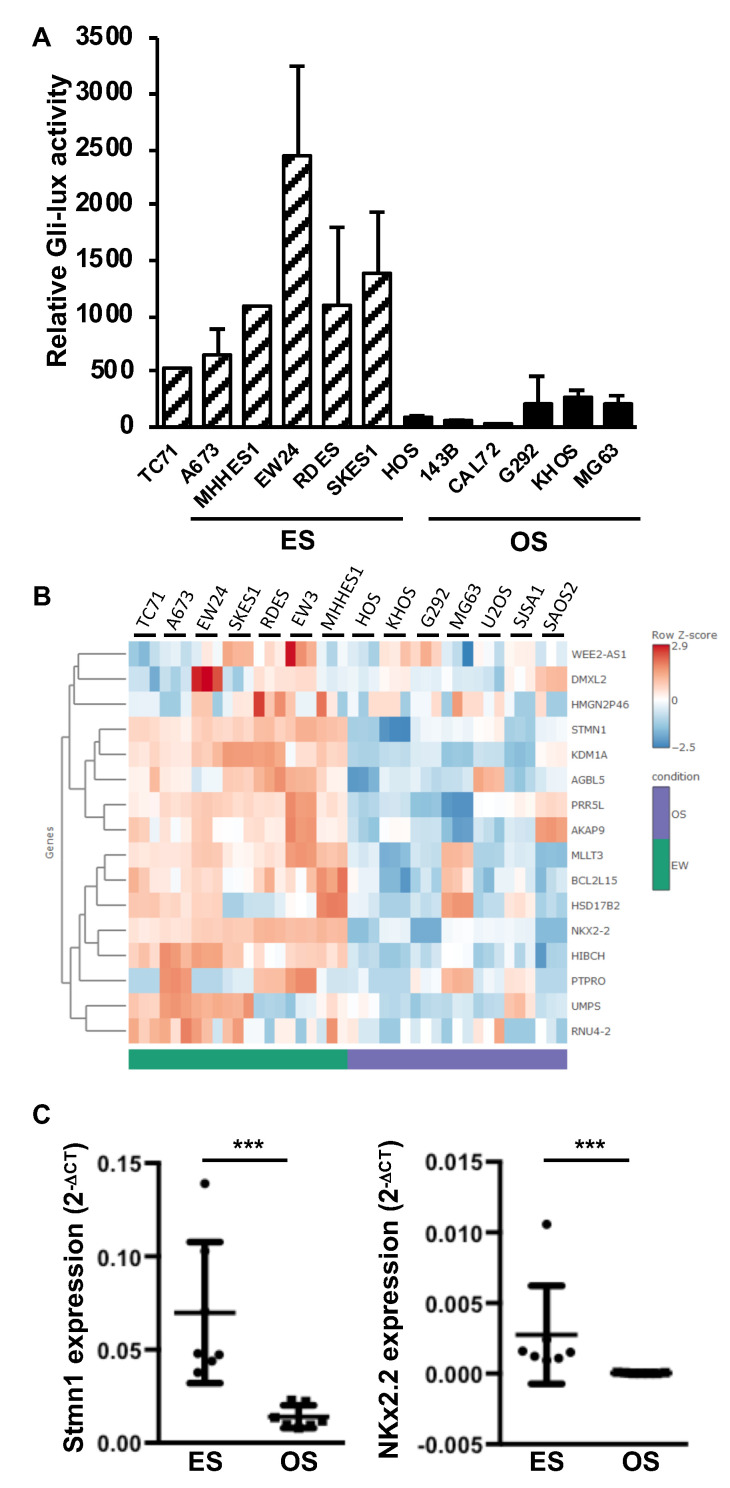
Figure 2.
Elevation of Gli1 target gene expression in ES cell lines. (A) six ES cells (TC71, A673, MHHES1, EW24, RDES and SKES1) and six OS cells (HOS, 143B, CAL72, G292, KHOS and MG63) were transiently transfected with the Gli-lux construct. Bars indicate means ± SD of 3 independent experiments, each performed in duplicate. (B) heatmap showing color-coded expression of SHH target genes in six OS cells and six ES cells following bioinformatics analysis of RNAseq data. High expression (red); low expression (blue). (C) Stmn1 and NKX2.2 mRNA steady-state levels were quantified by RT-qPCR analysis of seven OS cells and seven ES cells (each point represents the value of one cell line, bars indicate means ± SD of three independent experiments, each performed in triplicate, *** p < 0.001).

