Figure 3.
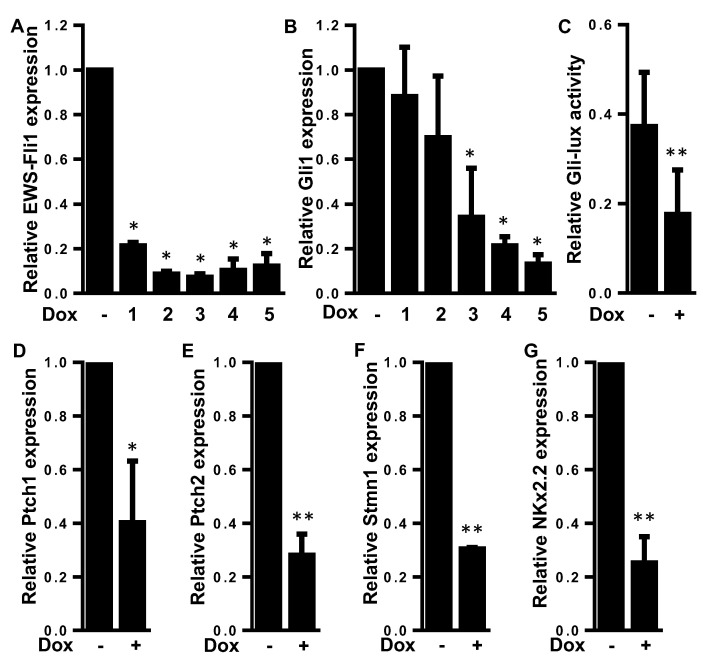
EWS-FLI1 drives the expression of Gli1 and the Gli transcriptional response in ES. (A,B) A673-1c ES cells were treated or not with doxycycline (1 μg/mL) during 1 to 5 days. EWS-FLI1 (A) and Gli1 (B) mRNA steady-state levels were quantified by RT-qPCR analysis. Bars indicate means ± SD of three independent experiments, each performed in triplicate (* p < 0.05). (C) A673-1c ES cells were treated or not with doxycycline (1 μg/mL). Then, 48 h after cells were transfected with the Gli-specific construct Gli-lux, and treated or not with doxycycline for another 24 h. Bars indicate means ± SD of three independent experiments, each performed in duplicate (** p < 0.005). (D–G) A673-1c ES cells were treated with doxycycline (1 μg/mL) for 24 h. Ptch1 (D), Ptch2 (E), Stmn1 (F) and NKx2.2 (G) mRNA steady-state levels were quantified by RT-qPCR analysis. Bars indicate means ± SD of three independent experiments, each performed in triplicate (* p < 0.05; ** p < 0.005).

