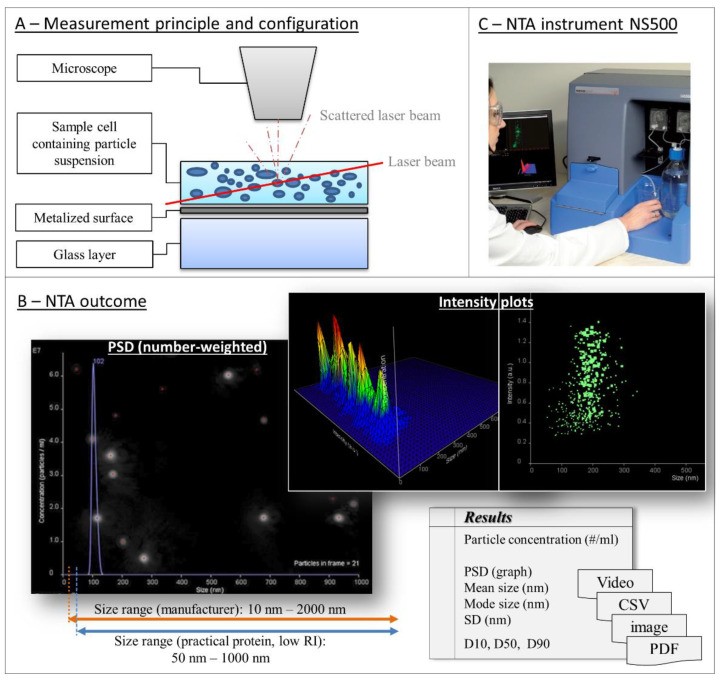
Figure 4.
Nanoparticle tracking analysis (NTA): instrument, measuring principle, and final outcome. (A) Schematic illustration of the measurement principle of the NTA instrument (Nanosight Ltd.). The particle suspension is pumped into the sample cell where the laser beam encounters the particle causing light scattering. The light scattering centers of each particle are recorded and afterwards used to determine the Brownian motion of each particle indirectly by the motion of the scatter center. (B) Example of a measurement result using the provided instrument software. The recorded scattering centers are tracked and finally the number-weighted PSD, 2D and 3D intensity plots and a total particle concentration are provided. The results are obtained as video file, graph image files, text file (.csv), and PDF-file. (C) NTA instrument NS500 (Nanosight Ltd.). Adapted with permission from [195], Elsevier, 2011.

