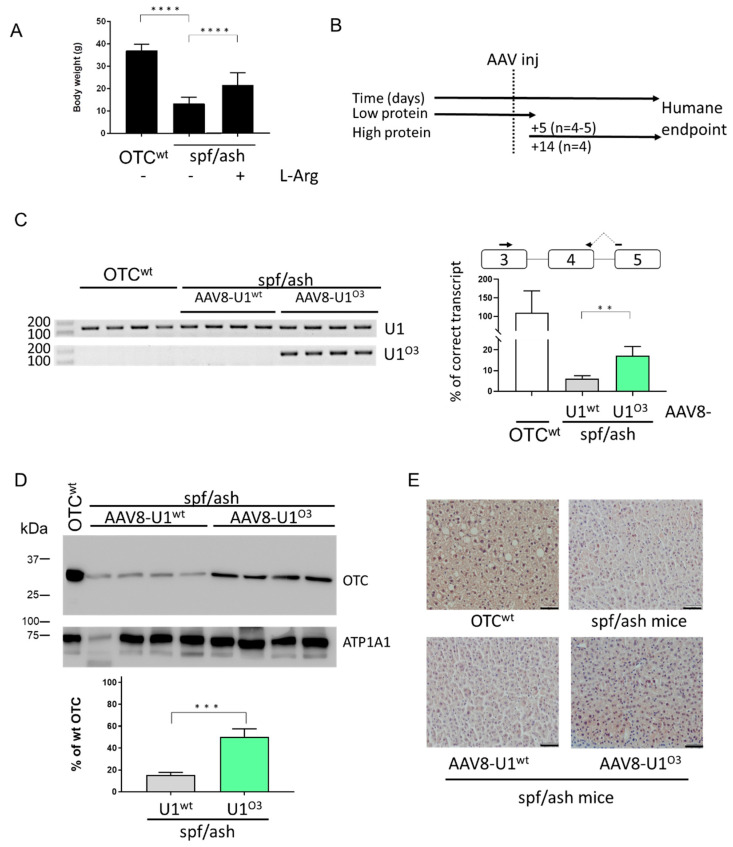
Figure 2.
Exon Specific U1snRNA (ExSpeU1)snRNA U1O3 restores OTC expression and ameliorates the spf/ash mouse phenotype. Asterisks represent P values: ** p ≤ 0.01, *** p ≤ 0.001, **** p ≤ 0.0001 (A) Mean body weight of OTC wt and spf/ash mice kept on a low protein diet with or without the supplementation of sucrose and L-Arginine. (B) Schematic representation of the protocol designed to perform the experiments in mice and exploiting the adeno-associated virus (AAV8)-mediated delivery of the U1O3. Five or fourteen days post-injection of 1 × 10¹³ vg/kg body weight of AAV8-U1O3, mice were challenged with a high protein diet. (C) Evaluation of U1snRNA expression (left) and correctly spliced OTC transcripts (right) in mouse liver samples. The schematic representation of the OTC gene is reported together with the exploited primers (arrows). The relative amount of correctly spliced transcripts in mice injected with the AAV8-U1O3 as compared to those in wild-type mice (%) is reported as mean ± SD from three independent experiments. (D) Western blotting analysis in liver homogenates from spf/ash mice injected with the AAV-U1wt or AAV-U1O3. Each line is an individual mouse. For each experimental group, four mice were randomly selected. The mouse ATPase Na+/K+ Transporting Subunit Alpha 1 (ATP1A1) was used as load control. The virtual protein marker, reporting the molecular size of bands, is reported on the left. The bars represent the relative amount of OTC protein as compared to that of the positive control (wild-type mouse liver), quantified by densitometric analysis. Results are reported as mean ± SD from three independent experiments. (E) Immunohistochemical analysis of OTC expression in mouse liver sections. Pictures represent examples of liver sections stained with a specific anti-OTC antibody (brown). Images are taken at 20× magnification. Scale bar, 50 µm.

