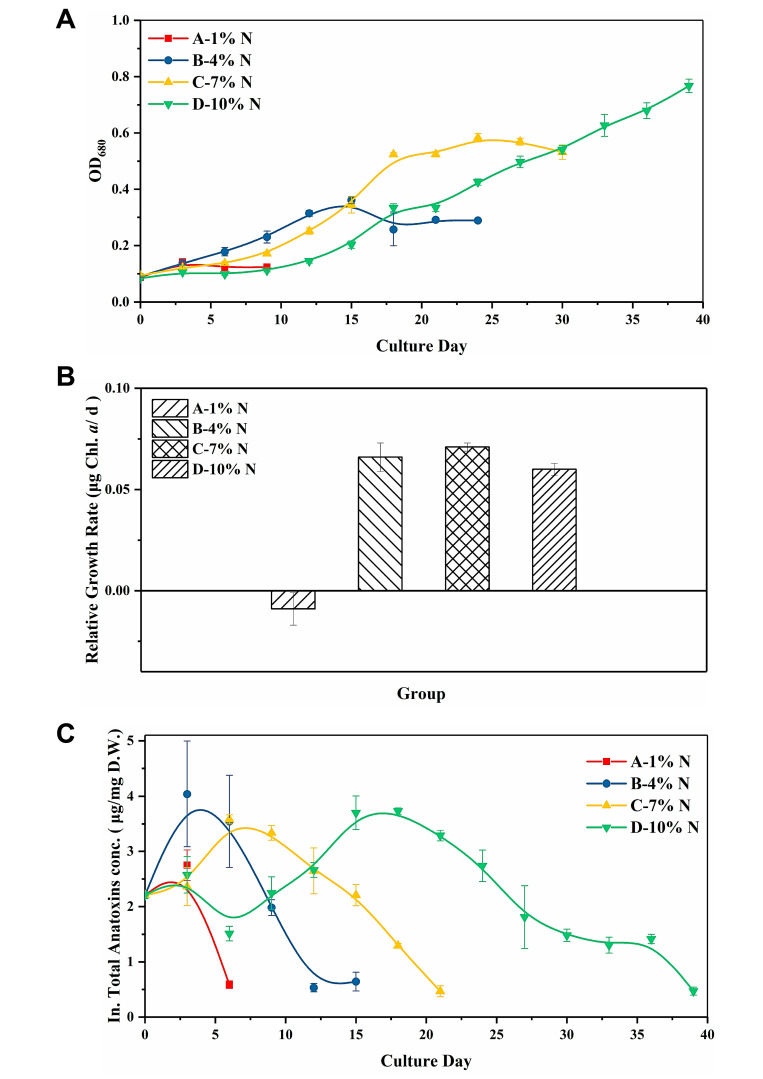
Figure 3.
Effect of different urea concentrations on the (A) OD680, (B) relative growth rate, and (C) total intracellular anatoxin concentration of C. issatschenkoi. The N concentration in groups A–D corresponded to 1%, 4%, 7%, and 10% of the N concentration in BG11, which was 0.176, 0.704, 1.232 and 1.76 mM, respectively.

