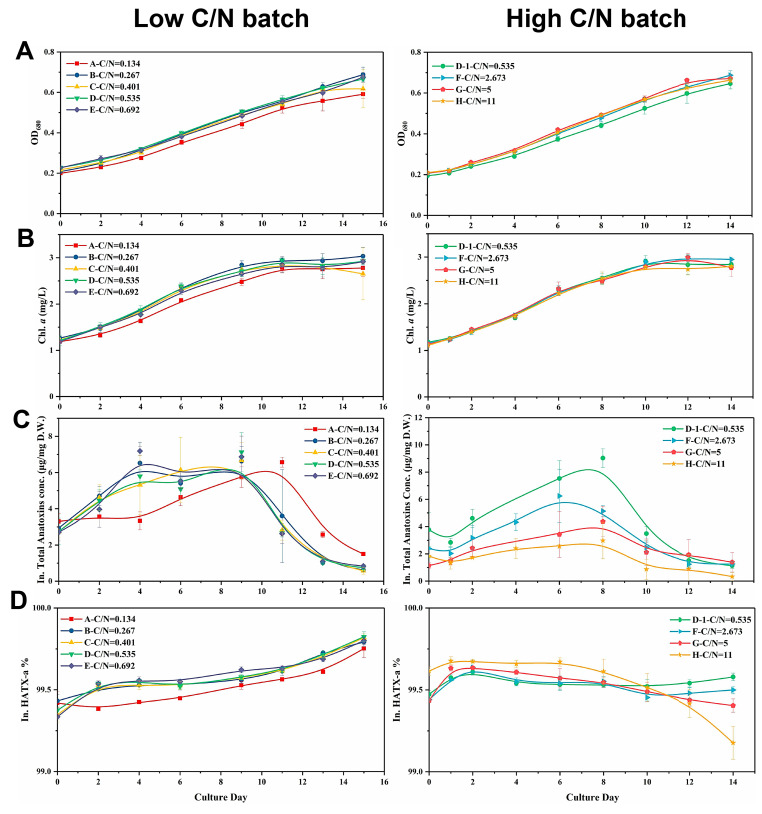
Figure 4.
Changes in (A) OD680, (B) Chlorophyll (Chl) a concentration, (C) Total intracellular anatoxins concentration, and (D) HATX-a proportion when cells were cultured under different exogenous C/N ratios. The left row represented the batch with low C/N ratios, and the right row represented the batch with high C/N ratios.

