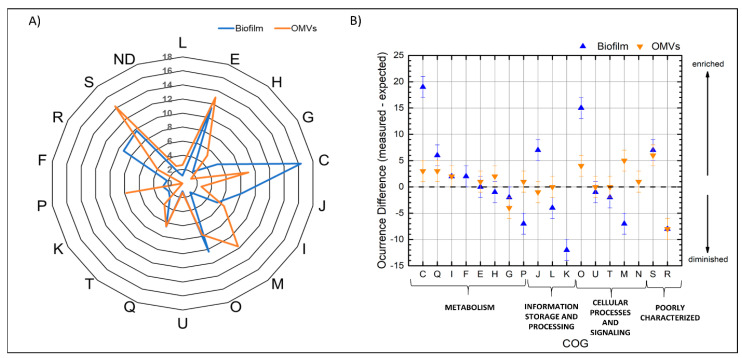
Figure 4.
(A) Percentage of the cluster of orthologous group (COG) functional categories of the identified proteins from the biofilm matrix and the OMVs. (B) Difference between the measured and the expected occurrence of the hypergeometric analysis. The positives values represent the enrichment of certain categories while the decrease of certain functional categories is represented by negatives values; when the expected value is identical to the measured one it is represented as zero. Letters represent the functional categories as follows: L: DNA replication, recombination and repair; E: metabolism and transport of amino acids; H: metabolism and transport of coenzymes; G: metabolism and transport of carbohydrates; C: production and conversion of energy; J: transcription; I: lipidic metabolism; M: Cell wall structure, biogenesis and outer membrane; O: posttranslational modifications; U: Intracellular trafficking, secretion, and vesicular transport; T: mechanisms of signal transduction; Q: metabolism and transport of nucleotides; P: transport of inorganic ions; N: cell motility; K: translation including ribosomes biogenesis; F: metabolism and transport of nucleotides; R: general prediction function only; S: function unknown; ND: not determined.

