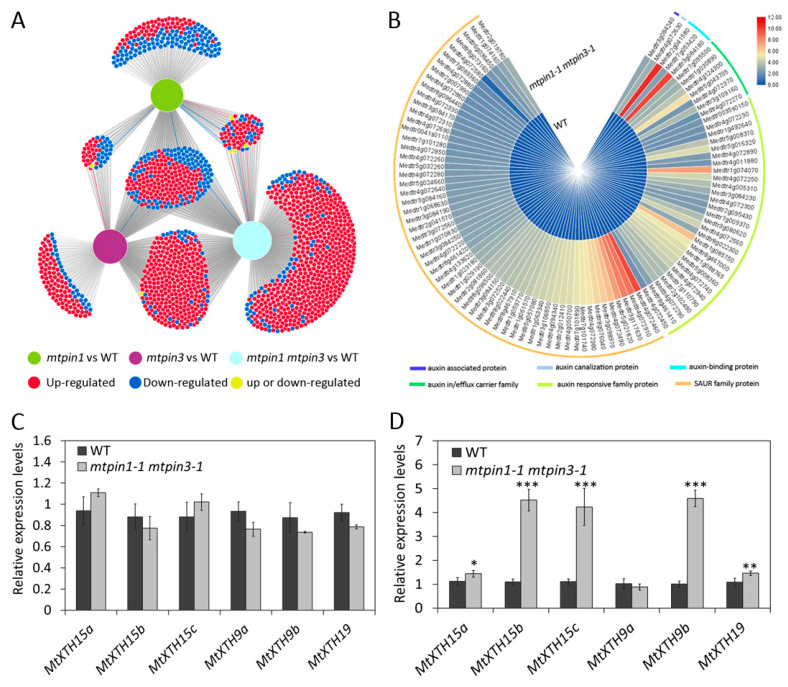
Figure 5.
Transcriptomic profiles of wild-type and mutants. (A) The full set of DEGs identified in leaves of mtpin1-1, mtpin3-1, and mtpin1-1 mtpin3-1. (B) The heatmap of auxin-related DEGs in mtpin1-1 mtpin3-1. (C,D) Relative expression levels of MtXTH15a, MtXTH15b, MtXTH15c, MtXTH9a, MtXTH9b, and MtXTH19, in the leaf (C) and petiole (D), in wild-type (WT) and mtpin1-1 mtpin3-1. Values are the means and SD of three biological replicates. * p < 0.05, ** p < 0.01, *** p < 0.001.

