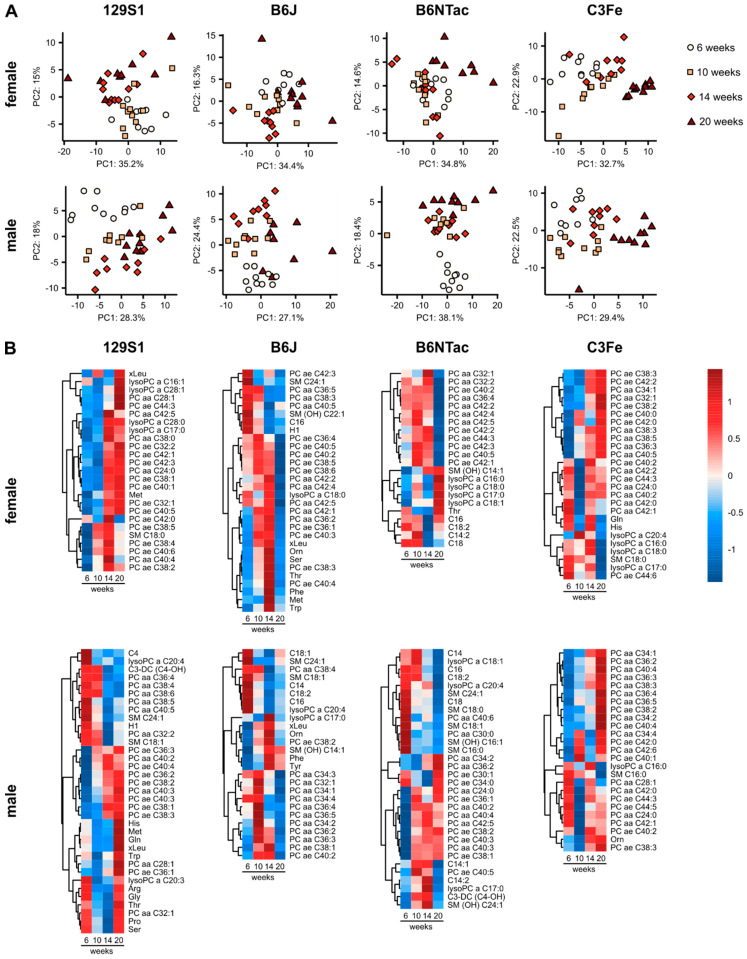
Figure 1.
Age-dependent metabolomic changes in murine plasma. (A) PCA of metabolomics data at 6, 10, 14, and 20 weeks of age. (B) Heatmaps of z scores of top metabolites distinguishing between age. Metabolites were selected based on loading scores of principle components 1 to 3 in PCA and the mean decrease in accuracy in random forest analysis. Z scores were calculated from scaled and centered mean metabolite concentrations. Analyses were performed for each mouse strain separately. Ester (a) and ether (e) bonds linking the fatty acids to the glycerol moiety are specified in the metabolite labels: acyl (a), diacyl (aa), acyl alkyl (ae).

