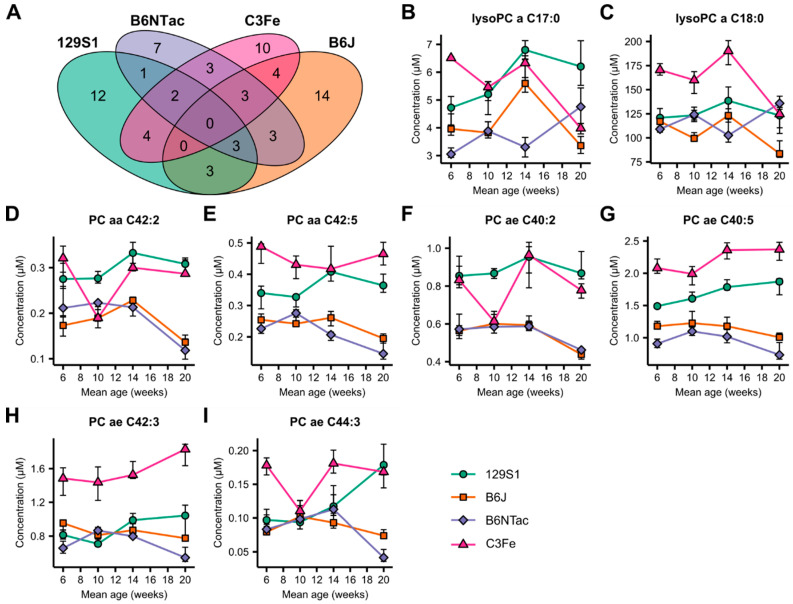
Figure 2.
Inter-strain comparison of age-dependent changes in the plasma metabolome of female mice. (A) Venn diagram depicting the overlap of strain-specific age-dependent metabolites. (B–I) Line-dot plots of metabolites showing age-dependent changes in three out of four mouse strains. Dots and error bars represent median and interquartile range (IQR), respectively. Fold changes and p-values can be found in Supplementary Table S5.

