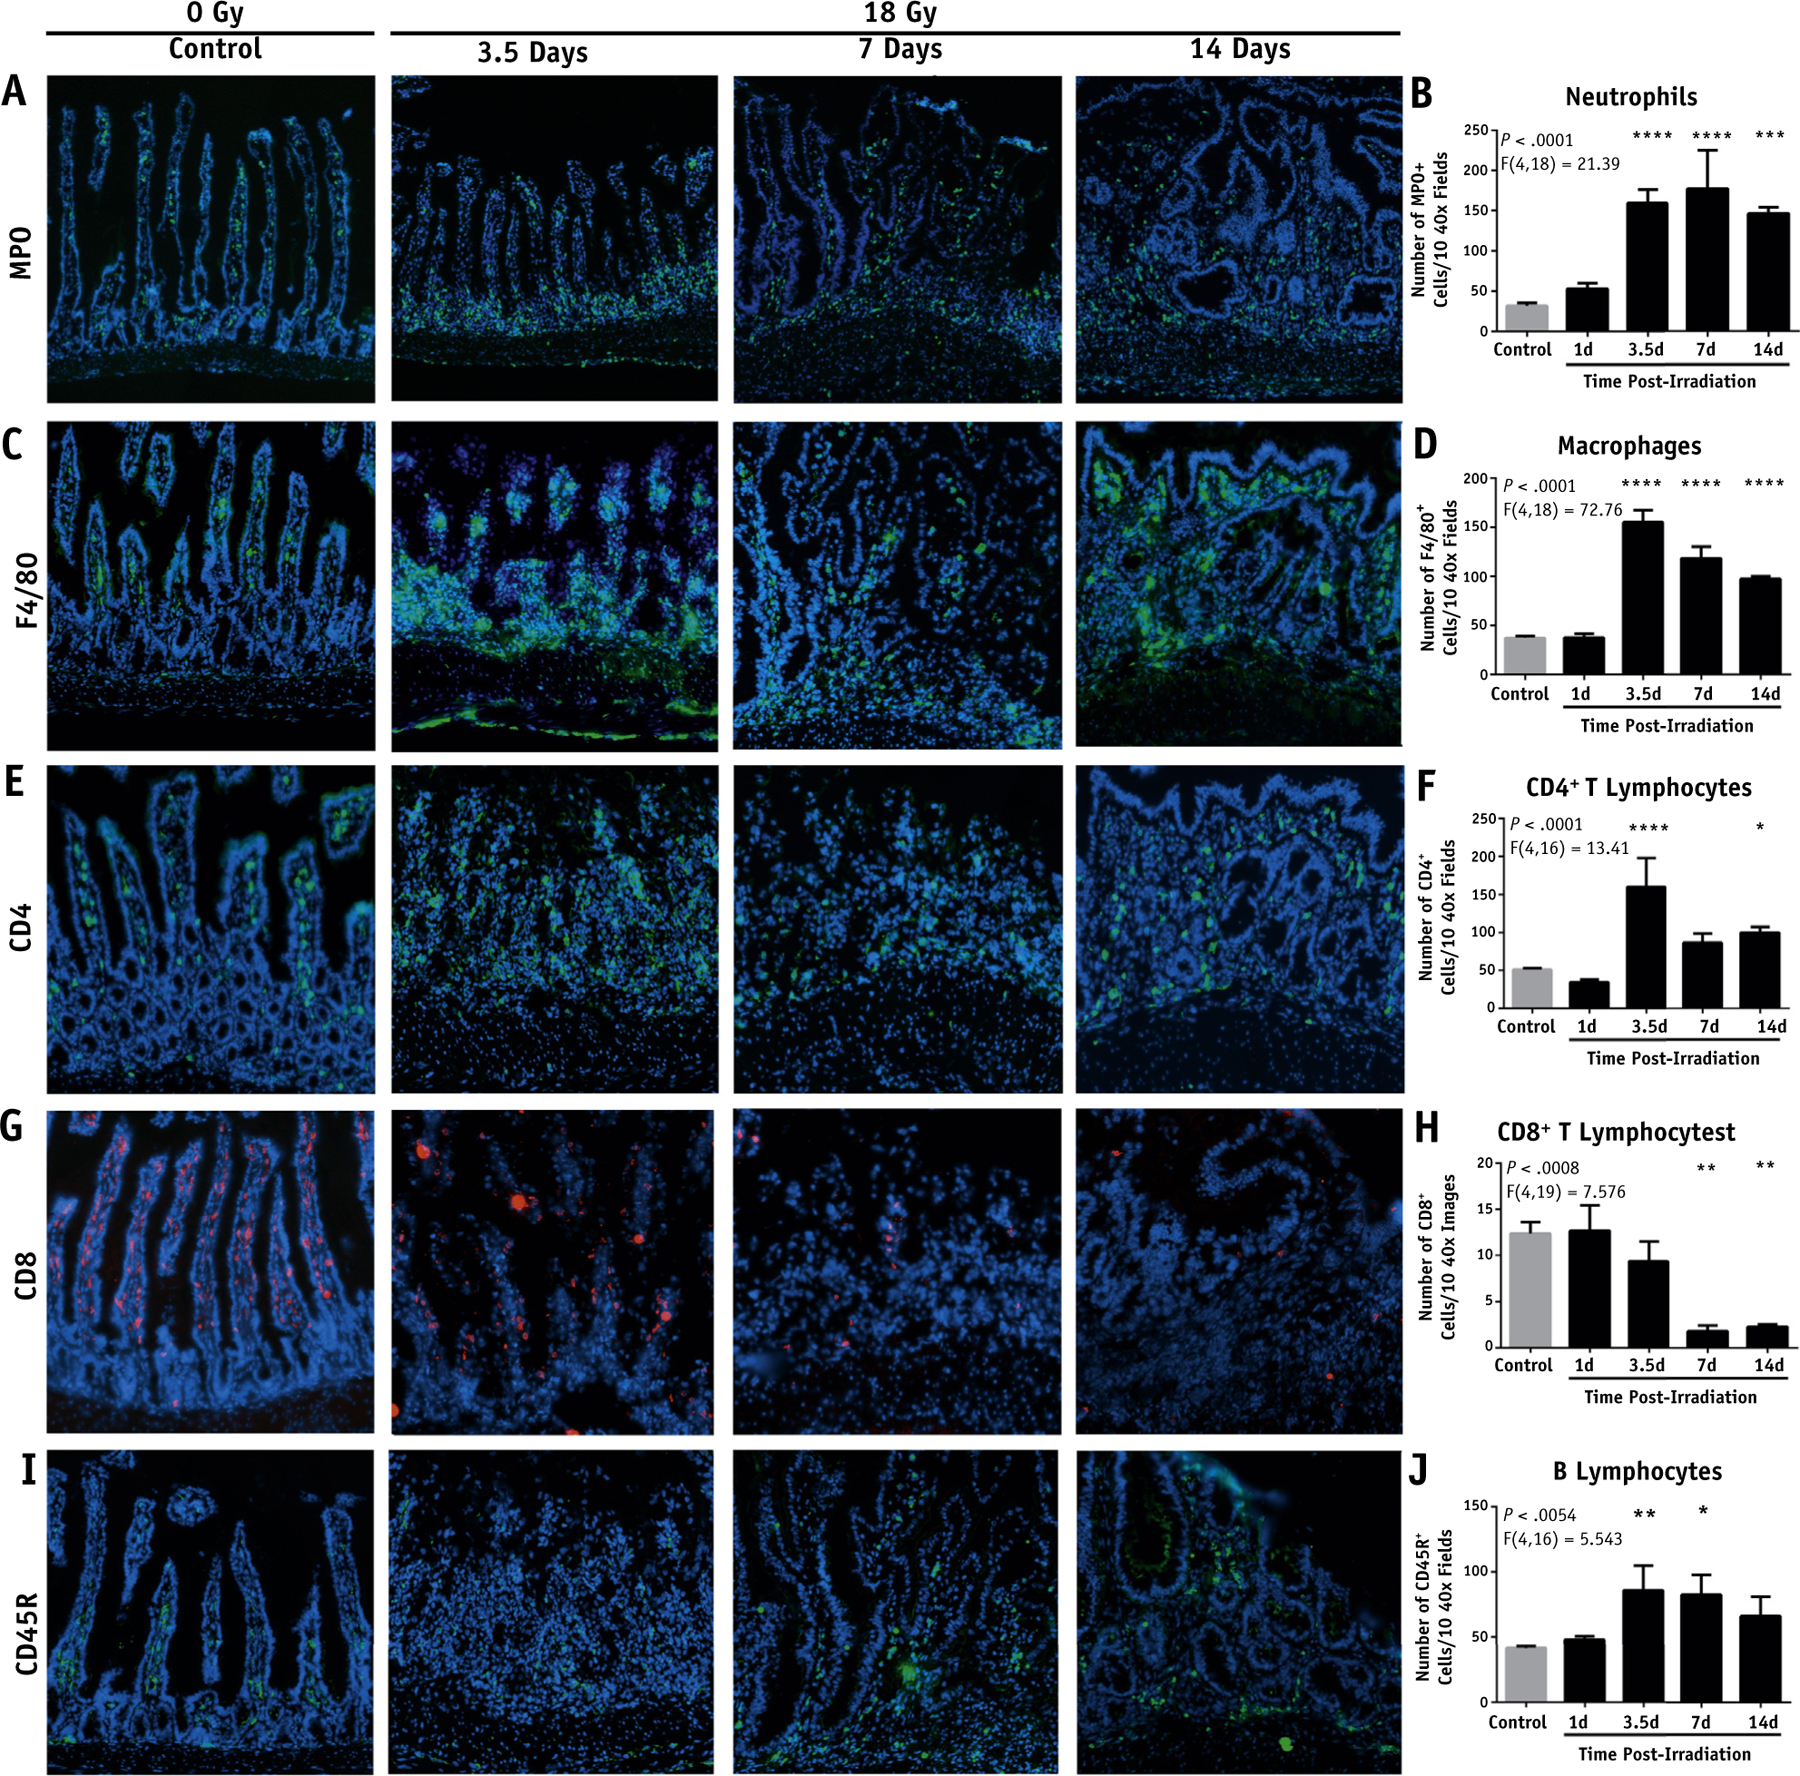
Fig. 2.

Evaluation of leukocyte infiltration into the intestine after focal irradiation (IR). Representative images of the marked intestine after a single dose of 18 Gy and the quantification of positive stained cells per 10 40× fields. (A, B) Myeloperoxidase+ cells. (C, D) F4/80+ cells. (E, F) CD4+ T cells. (G, H) CD8+ T cells. (I, J) CD45R+ B cells (stitched 40× magnification; scale bar, 50 μm). P < .05 (*), P < .01 (**), P < .001 (***), P < .0001 (****).
