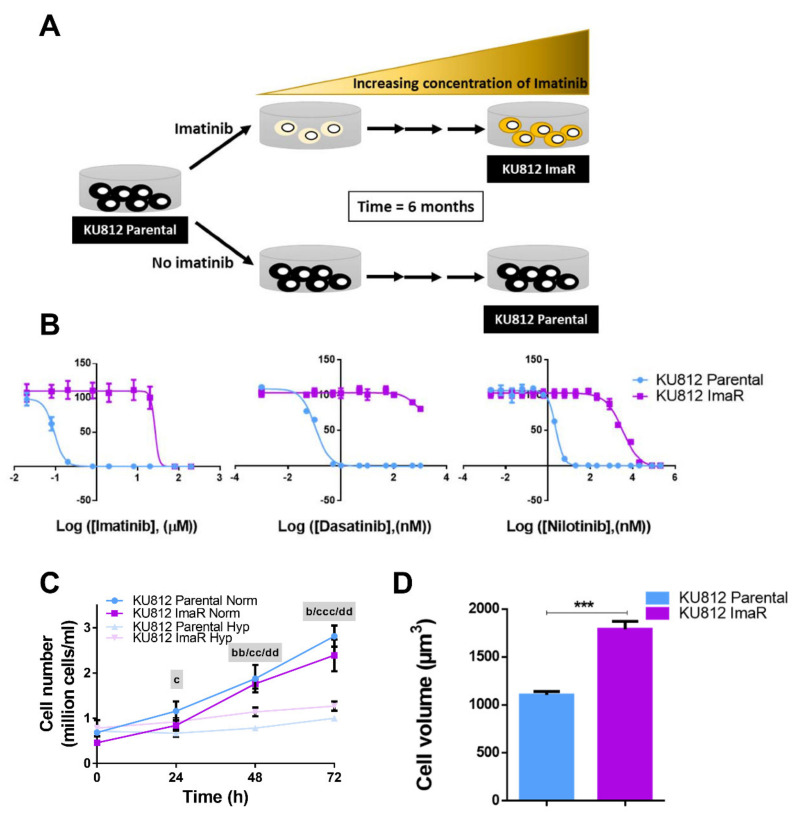
Figure 1.
Phenotype, acquisition of TKIs resistance and changes in the principal biological processes of KU812 ImaR cells when compared with KU812 Parental cells. (A) Graphical description of the generation of an imatinib-resistant KU812 cell model (KU812 ImaR) under normoxia (Norm) by exposure of imatinib increasing concentrations. (B) Representative experiment (mean ± SD for n = 3 of n = 2 independent experiments) of the effect of three different clinically-relevant tyrosine kinase inhibitors (TKIs) on the cell viability of KU812 Parental and ImaR cell. Cells were incubated for 72 h with DMSO (vehicle control) or increasing concentrations of the corresponding inhibitor. Viability of the cells at each concentration was analyzed, and the half-maximal inhibitory concentrations (IC50) was determined. (C) Growth curve of KU812 parental and KU812 ImaR cells under normoxia and hypoxia (Hyp). The data represent mean ± SD for n = 3 of n = 2 independent experiments. Statistically significant differences were determined by two-tailed independent sample Welch’s t-test between KU812 ImaR and KU812 Parental in hypoxia (b), KU812 Parental in normoxia vs. hypoxia (c), or KU812 ImaR in normoxia vs. hypoxia (d) (p < 0.05 (b, c), p < 0.01 (bb, cc or dd), p < 0.001 (ccc). (D) Cell volume of KU812 P and KU812 ImaR cells under normoxia measured with the ScepterTM Handheld Automated Cell Counter. Statistically significant differences in all the panels was determined by two-tailed independent sample Student’s t-tests: *** p < 0.001.

