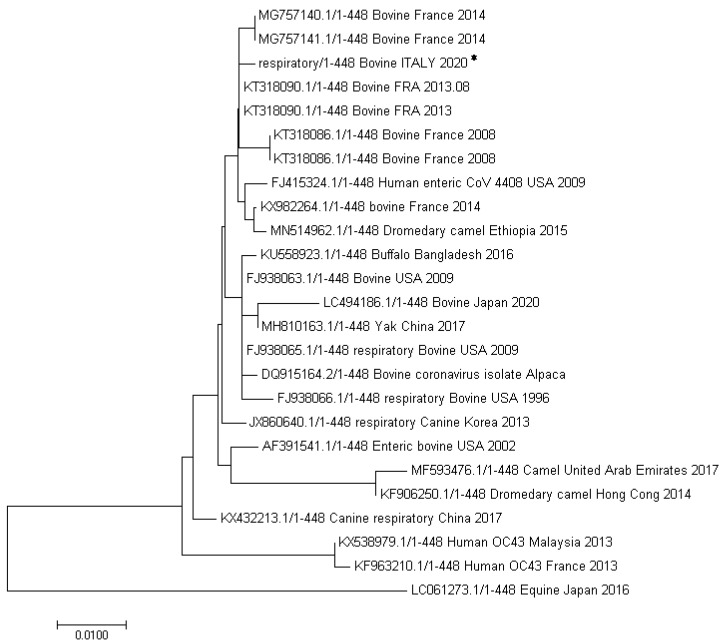
Figure 5.
Phylogenetic analysis of a part of the N gene (454 bp). The evolutionary history was inferred using the Neighbor-Joining method [16]. The optimal tree with the sum of branch length = 0.10942734 is shown. The evolutionary distances were computed using the Poisson correction method and are in the units of the number of amino acid substitutions per site. Evolutionary analyses were conducted in MEGA7 [17]. Sequence obtained in the present study (Bovine ITALY 2020) is indicated with an asterisk.

