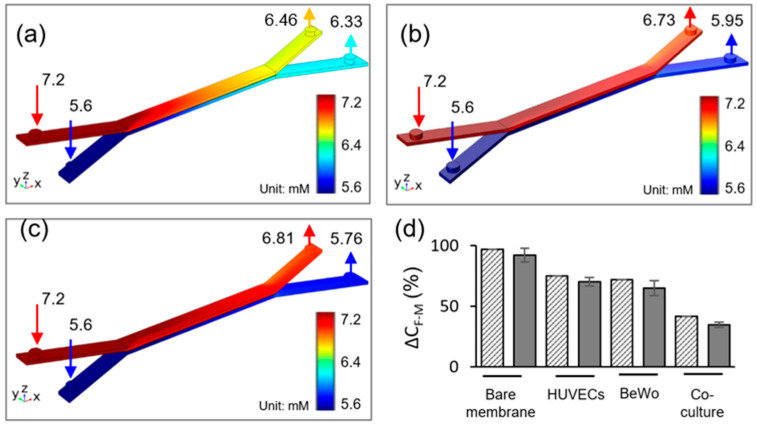
Figure 3.
Glucose concentration profiles at flow rate of 50 μL/h in (a) bare membrane, (b) trophoblast monoculture, (c) trophoblast/HUVEC co-culture. (d) Comparison between experimental data and numerical simulation of glucose diffusion rate, ΔCF-M across the maternal-fetal interface for 2 h experiment time, under the 50 μL/h flow rate. Gray solid fill—experimental data, pattern fill—numerical simulation.

