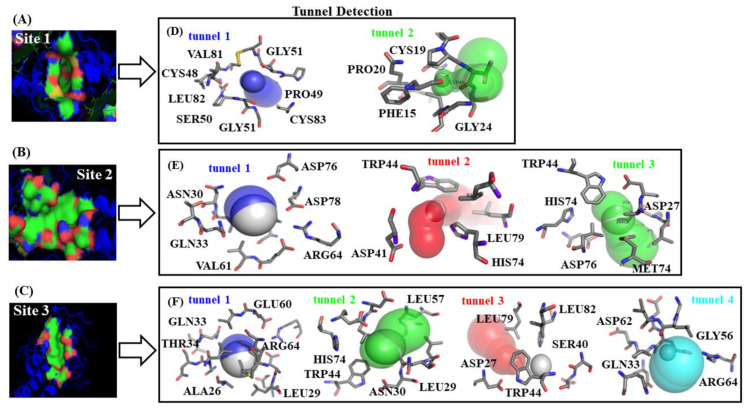
Figure 3.
On the left, van der Waals surface representation of the three best-ranked fibrinogen binding-sites, namely: (A) site 1, (B) site 2, and (C) site 3. Therein, red and blue regions represent acid and basic residues, respectively. On the right, (D–F) representation of the different tiny cavities such as tunnels detected for each predicted fibrinogen binding site with the corresponding surrounding target-residues.

