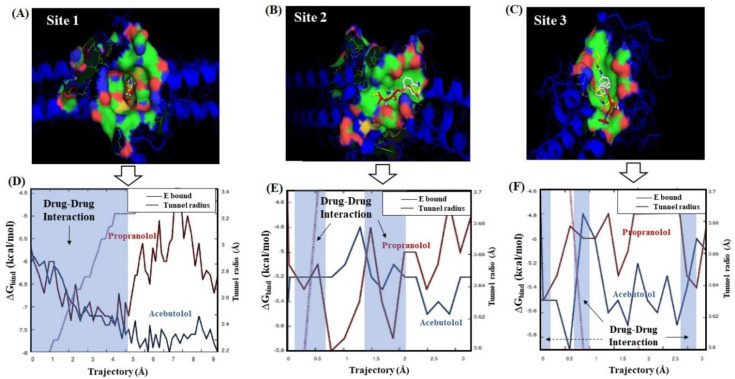
Figure 4.
On the top, van der Walls surface representation for the best drug–drug interaction (DDI) systems forming stable docking complexes with the fibrinogen E-region binding sites. (A) A plus P at site 1; (B) A plus P at site 2; and (C) A plus P at site 3. On the bottom, panels (D–F) show the individual Gibbs free energy profiles (ΔGbind) from both beta-blockers plotted as a function of the trajectory and the fibrinogen tunnel radius across the predicted catalytic sites. Therein, the corresponding energy profile of A and P is depicted in red and blue solid lines, respectively. The transparent blue rectangle with the black arrow in each panel indicates the occurrence of DDI events—i.e., A and P interacting at the same biophysical environment in sites 1, 2, and 3. For comparison purposes, please refer to Figure S2, where the LTA results for the worst fibrinogen binding site are shown.

