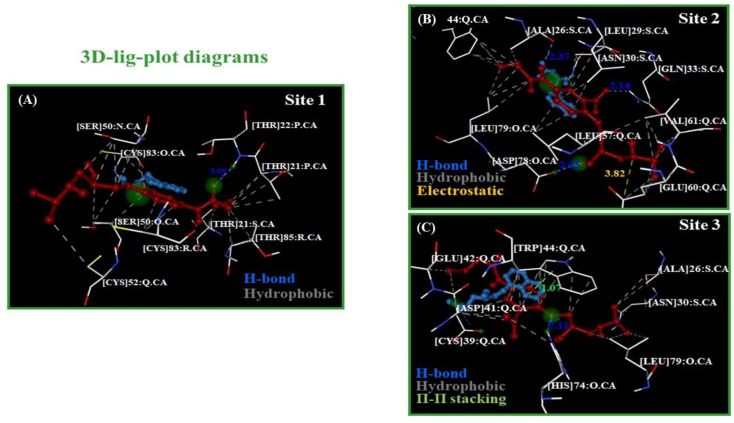
Figure 5.
Representation of 3D-lig-plots diagrams for the best beta-blocker drug–drug binding-poses. (A) A plus P at site 1; (B) A plus P at site 2; and (C) A plus P at site 3 (A displayed in red color and P in blue). Therein, the atoms from target-residues colored in green correspond to potential hotspots for maximum drug–drug interactions between both beta-blockers in each fibrinogen binding site evaluated.

