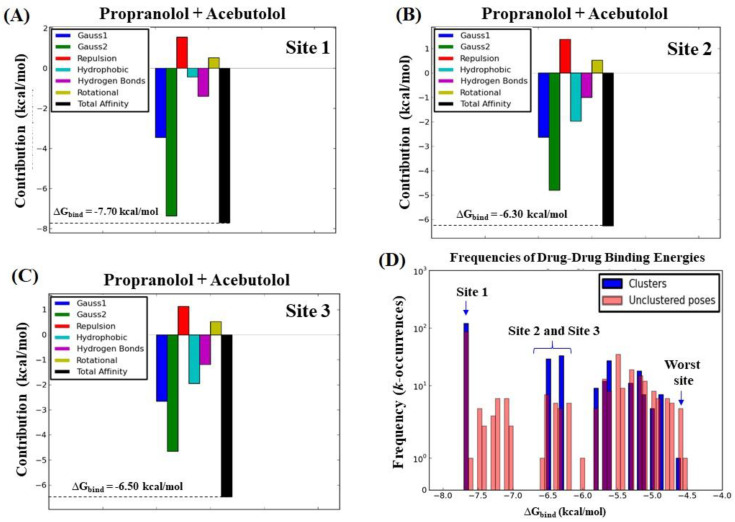
Figure 6.
Graphical breakdown of the different binding energy contributions of the total binding affinity () with the corresponding values obtained from the simultaneous interaction of both beta-blockers with the fibrinogen E-region binding sites. (A) A and P at site 1 ( = −7.70 kcal/mol); (B) A and P at site 2 ( = −6.30 kcal/mol); and (C) A and P at site 3 ( = −6.50 kcal/mol). Therein, different colors were used to distinguish the type of thermodynamic contribution, namely: attractive energy dispersion based on two Gaussian functions (Gauss1 and Gauss2 in blue and green, respectively), repulsion energy (red), hydrophobic energy (light blue), hydrogen bond energy (purple), rotational energy (yellow), and total affinity (black). (D) Frequency distribution of the total binding energies, in which the x-axis pertains to the drug–drug total affinities () and the y-axis to their frequencies of occurrence (k-occurrences), obtained from both the docked drug–drug poses (blue bars) and the undocked drug–drug poses (pink bars).

