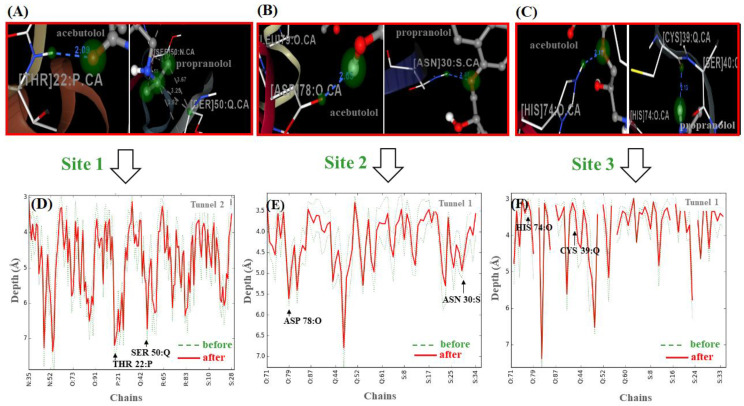
Figure 8.
On the top, for each beta-blocker, critical target-residues interacting with the ligand atoms that showed the maximum atom energy contribution to the individual binding affinity. (A) THR22:P_site1/(A)-oxygen-(2)-atom and SER50_site1: Q/(P)-C-atoms_ (C2, C3, C4); (B) ASP78:O_site2/(A)-oxygen-(2)-atom and ASN30:S/(P)-N-atom; (C) HIS74:O_site3/(A)-oxygen-(1)-atom and CYS39: Q_site3/(P)-N-atom. On the bottom, (D–F) correspond to the depth profiles (D[c,i] vs. chains) for the critical target-residues linked to their corresponding side-chains into the relevant tunnels. Therein, the amplitude of the depth peaks was evaluated before (green dashed lines) and after beta-blocker interactions (red solid lines).

