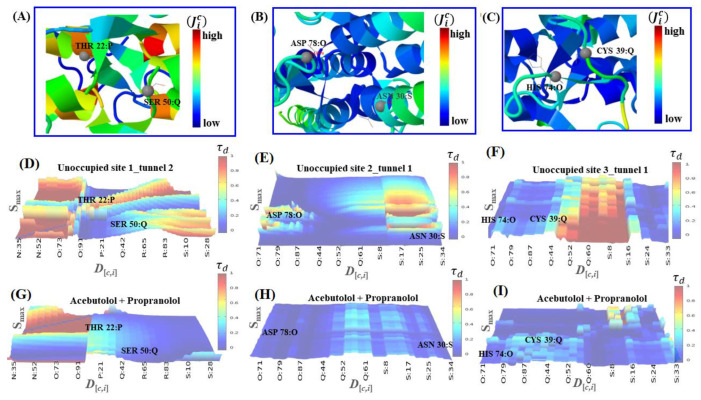
Figure 9.
On the top, graphical representation of the beta-blocker binding ability for critical fibrinogen target-residues based on the depth quasi-sequence-position-order descriptor (Ji). (A) THR22:P, SER50: Q; (B) ASP78:O, ASN30:S; and (C) HIS74:O, CYS39:Q. Orange and red colored regions depict high binding ability for the beta-blockers, while blue ones show low binding ability. On the bottom, 3D-surface maps of the quasi-sequence-order-coupling descriptor () as a function of residue depth D[c,i] vs. maximum solvent accessibility. The simulation conditions considered to study the depth perturbation on the aforementioned target-residues are: (D) unoccupied site 1 (tunnel 2); (E) unoccupied site 2 (tunnel 1); and (F) unoccupied site 3 (tunnel 1). (G–I) The later panels refer to the last simulation condition considered—that is, the study of the residue depth perturbations of the aforementioned target-residues under the influence of drug–drug interactions with both beta-blockers A plus P. Therein, the color bar on the right of each map represents the residue depth perturbations based on the values of descriptor , which range from weak (blue) to strong (orange/red) ones.

