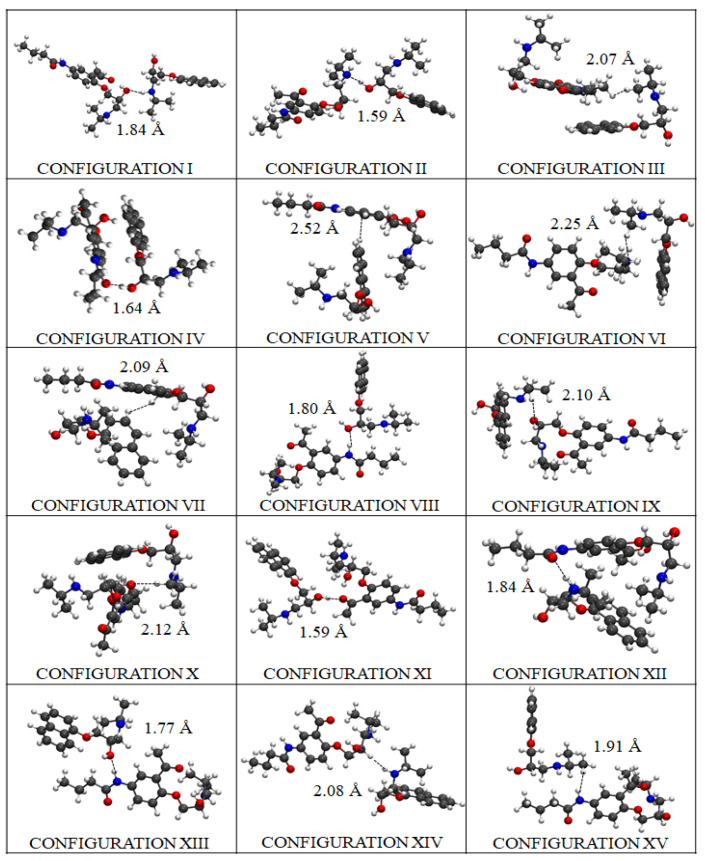
Figure 11.
DFT results for the fifteen most stable thermodynamically drug–drug binding configurations (from I to XV) adopted by the beta-blockers A and P during the pharmacodynamic interactions (i.e., modeled in the absence of fibrinogen E-region). The beta-blocker atoms are depicted as ball and sticks and colored as follows: dark gray (C-atoms), red (O-atoms), blue (N-atoms), and light gray (H-atoms).

