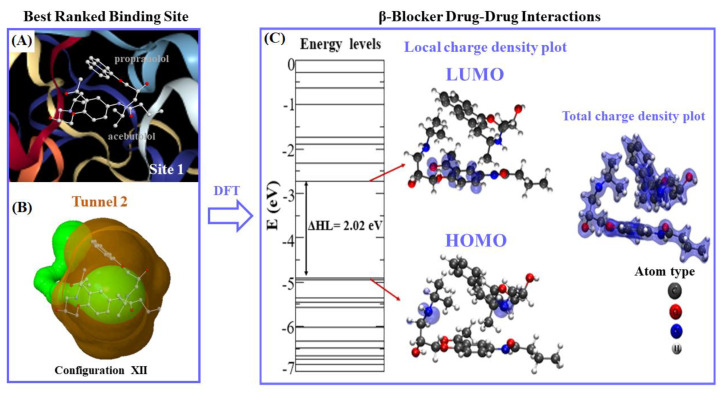
Figure 12.
(A) Representation of the best-ranked drug–drug binding configuration XII formed by the A + P/fibrinogen complex in the fibrinogen E-region binding site 1. (B) Topological representation of the tunnel 2 (colored green) containing the best-ranked drug–drug binding configuration XII for molecules A + P interacting simultaneously at the same biophysical environment (ball and sticks representation) in binding site 1 (surrounding shaded orange region). (C) Energy levels and iso-surfaces of the local charge electronic density and total charge density plots obtained for the best-ranked drug–drug binding configuration XII (A + P). The electronic levels are depicted as solid lines with the HOMO-LUMO energy difference gap (ΔHL), and the density plots are shown, using orbital charge density iso-surfaces of 0.002 eV/Å3. The A and P atoms are depicted as ball and sticks and colored as follows: dark gray (C-atoms), red (O-atoms), blue (N-atoms), and light gray (H-atoms).

