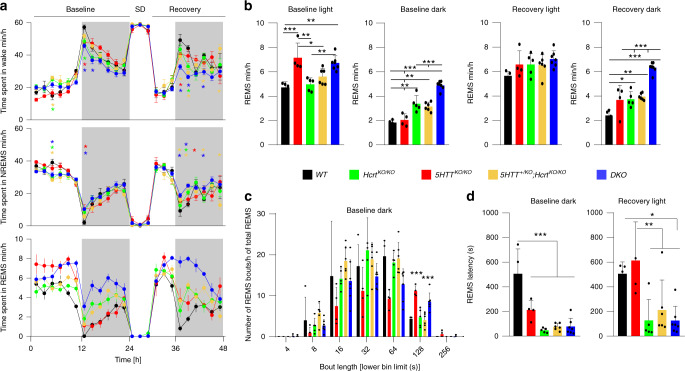
Fig. 1. Increased REMS time in 5HTTko/ko mice and its regulation by HCRT.
a Time-course of vigilance states; Wakefulness (top), NREMS (middle) and REMS (bottom). 5HTTKO/KO mice show a large increase in REMS amount during the light period, while HcrtKO/KO and DKO mice show a large increase in the dark period both at baseline and during recovery (two-way ANOVA, time × genotype F (92,483) = 2.94 (wakefulness), 2.37 (NREMS) and 4.64 (REMS), P < 0.0001, followed by Dunnett’s test, WT vs 5HTT+/KO;HcrtKO/KO *, DKO *, 5HTTKO/KO *, HcrtKO/KO *, P < 0.05). Data points are shown in minutes per hour and represent the average of 2 h. Baseline represents the average of the 2 recording days that preceded sleep deprivation (SD). b From left to right: the total amount of REMS during baseline light, dark and recovery light and dark periods (one-way ANOVA, genotype F (4,21) = 10.6, 41.80, 1.89, and 30.70, respectively, P = 0.14 for recovery light and P < 0.0001 for the rest, followed by Tukey test). c Distribution of REMS bout durations indicates significantly longer bouts in 5HTTKO/KO and DKO mice. Lower numbers for each bout duration bin are presented on the x axis (one-way ANOVA, genotype F (4, 21) = 15.03, P < 0.0001, followed by Tukey test). d REMS latency is dramatically decreased in genotypes carrying a mutant Hcrt allele, both in baseline dark period and immediately after SD (one-way ANOVA, genotype F (4, 21) = 19.74 (baseline dark, P < 0.0001) and 6.31 (recovery light, P < 0.002) followed by Tukey test). *P < 0.05; **P < 0.01; ***P < 0.001 for (b–d). Values are mean ± SD. DKO: n = 7, 5HTTKO/KO: n = 4, HcrtKO/KO: n = 5, 5HTT+/KO;HcrtKO/KO: n = 6 and WT: n = 4.

