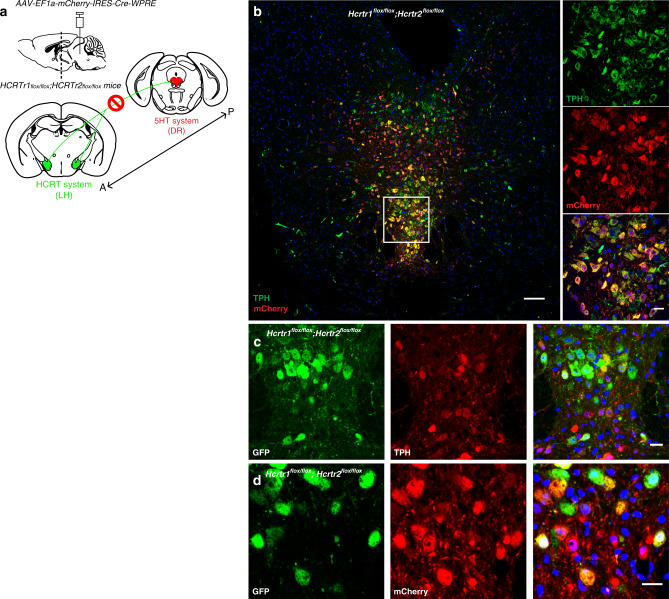
Fig. 4. Inactivation of Hcrtr1&2 in the DR.
a Schematic figure depicting the experiment where the HCRT input (from posterior “P” to anterior “A) to the dorsal raphe (DR) is disrupted. b Representative confocal image of the DR of Hcrtr1&2 double-floxed homozygous mice injected with AAV-EF1a-mCherry-IRES-Cre-WPRE and stained with mCHERRY (red) and TPH (green) antibodies. mCHERRY-positive cells (red) are highly co-localized with TPH-positive cells (green). Higher magnification (×40, right). c, d GFP is expressed after Cre recombination. TPH-positive cells (c middle red) transduced with Cre virus (d middle red) are positive for GFP (c and d, left green). Scale bars: b 100 μm, rest 20 μm.

