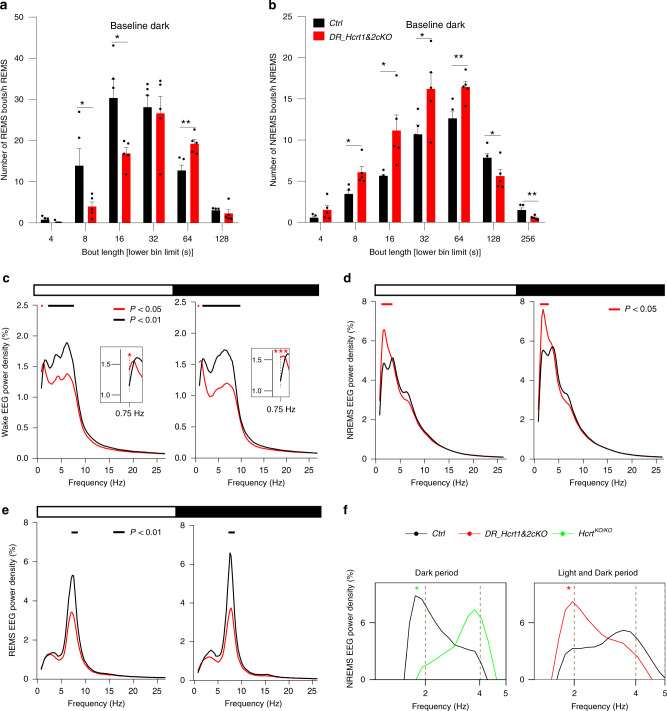
Fig. 5. Profound alterations in vigilance states quality in DR Hcrtr1&2 gene-inactivated mice.
a Distribution in REMS bout durations during the dark period. Lower numbers in each bout duration bin are presented on the x axis. REMS is markedly consolidated in DR_Hcrtr1&2-cKO mice (unpaired 2-tailed t-test, t (8) = 2.27 for 8 s, P = 0.05), 2.88 for 16 s, P < 0.05, and 3.87 for 64 s, P < 0.01, mean ± SEM). b Distribution of NREM bout durations during the dark period. NREMS is highly fragmented in DR_Hcrtr1&2-cKO mice (unpaired two-tailed t-test, t (8) = 3.25 for 8 s, P < 0.05, 2.86 for 16 s, P < 0.05), 2.36 for 32 s, P < 0.05, 3.61 for 64 s, P < 0.01, 2.41 for 128 s, P < 0.05) and 3.39 for 256 s, P < 0.01, mean ± SEM). c Baseline waking EEG power spectra during light (left) and dark (right) periods. Data are normalized to the total EEG power during baseline. Insets show higher magnification of lower frequencies (two-way ANOVA, interaction frequency × genotype F (196, 1568) = 3.86 (light), 5.7 (dark), P < 0.0001, followed by Dunnett’s test, horizontal bars join frequency bins for which P < 0.05). d Baseline EEG power spectra for NREMS (two-way ANOVA, interaction frequency × genotype F (196, 1568) = 2.26 (light), 1.81 (dark), P < 0.0001, followed by Dunnett’s test, P < 0.05). e Baseline EEG power spectra for REMS (two-way ANOVA, interaction frequency × genotype F (196, 1568) = 6.51 (light), 7.15 (dark), P < 0.0001, followed by Dunnett’s test, P < 0.05). f The slow-delta in NREMS of HcrtKO/KO and DR_Hcrtr1&2-cKO mice. HcrtKO/KO mice show a profound decrease, while the disruption of HCRT input to the DR largely enhances NREMS slow-delta power (two-way ANOVA, interaction frequency × genotype F (388, 2037) = 2.52 (left), F (196, 1568) = 2.26 (right), P < 0.0001, followed by Dunnett’s test, WT vs. HcrtKO/KO* and vs. DR_Hcrtr1&2-cKO* P < 0.05). DR_Hcrtr1&2-cKO n = 5, and control mice n = 5.

