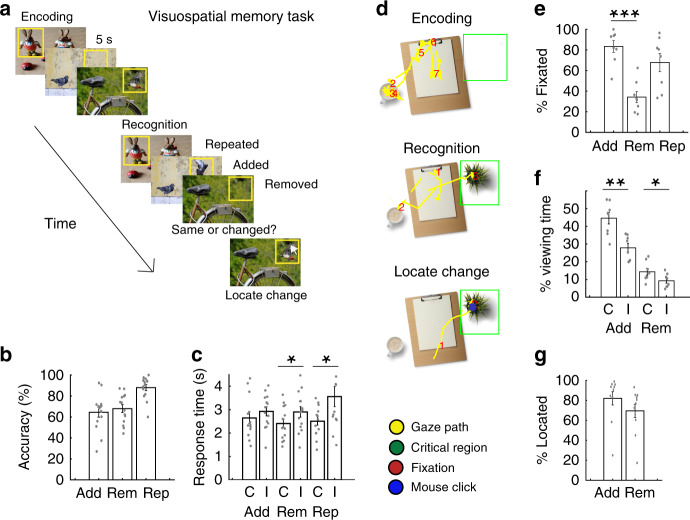
Fig. 1. Visuospatial memory task.
a Participants viewed and encoded into memory a series of images. During recognition testing, participants indicated whether the images were manipulated (items added or removed) or whether they were identical to the encoded images. Participants subsequently identified the location of the manipulation using a mouse click. b Probability of successful recognition for the added (Add), removed (Rem), and repeated (Rep) conditions across participants. c Mean response times for correct (C) and incorrect (I) responses for added, removed, and repeated conditions across 14 participants. Response times were significantly faster when participants correctly recognized removed and repeated images compared to when they were incorrect (removed, t(13) = −2.31, p = 0.038, repeated t(12) = −2.85, p = 0.014). d Representative eye-movements during encoding, recognition, and identification of the location of the manipulation. We converted the gaze path (yellow) into fixations (red) and calculated the percentage of fixations within the critical region of each image (green box). e Probability of fixation within the critical region for correctly recognized added, removed, and repeated items across 8 participants. We selected a random item as the critical region for the repeated condition to assess the probability of baseline fixations. Participants spent at least one fixation on a greater percentage of the successfully recognized added compared to removed items (t(7) = 11.2, p = 10−5). f Probability of viewing time within critical region for correctly and incorrectly identified images across 8 participants. Participants spent a greater percentage of time viewing both the added item and the region of the removed item during correct compared to incorrect trials (added, t(7) = 4.93, p = 0.002; removed, t(7) = 2.52, p = 0.040). g Probability of mouse click within critical region for correctly recognized added and removed conditions across participants. All error bars indicate standard error of mean. Asterisks (*, **, ***) indicate significance at p < 0.05, p < 0.01, and p < 0.001, respectively; two-sided paired t tests.

