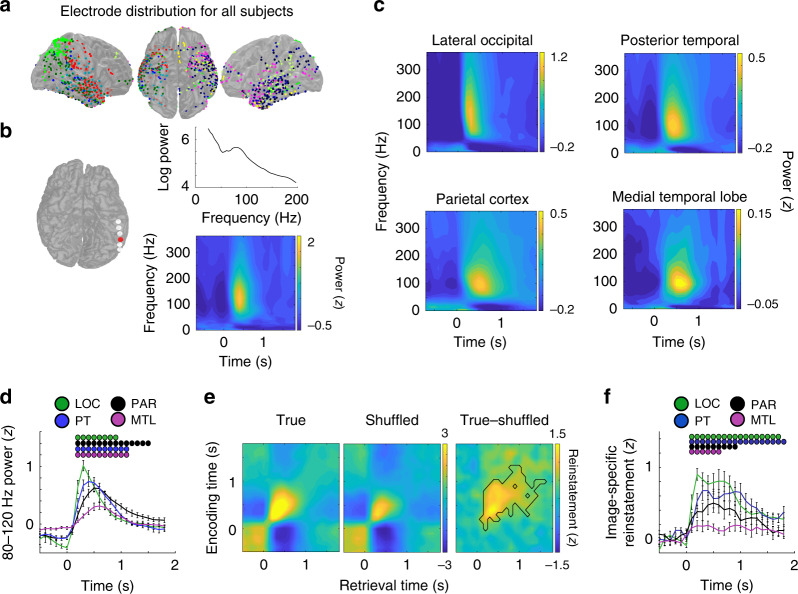
Fig. 2. Feedforward transmission of 80–120 Hz power between cortex and medial temporal lobe reflect specific visual experiences.
a Intracranial electrode locations for all 14 participants. Each color corresponds to an individual participant. b In a representative electrode in the posterior temporal lobe (red), a single trial exhibits an increase in power in the 80–120 Hz band during recognition testing (top). Across all trials in this electrode, images during the recognition period elicited increases in 80–120 Hz power. c Across participants, image presentation during the recognition period evoked increases in 80–120 Hz power in the lateral occipital cortex (LOC), posterior temporal lobe (PT), parietal cortex (PAR), and medial temporal lobe (MTL). d Average time course of 80–120 Hz power during the recognition period in each brain region across participants (200 ms sliding windows, 50% overlap; image appears at t = 0). Dots indicate significant increases in 80–120 Hz power compared to baseline, corrected for multiple comparisons across 6 LOC, 8 PAR, 10 PTL, and 10 MTL participants (p < 0.05, permutation procedure). e Reinstatement of 80–120 Hz power distributed across all electrodes, averaged across all participants. The difference in average reinstatement between the true and shuffled distributions reflects image-specific reinstatement across all participants (black outline, p < 0.05, permutation procedure). f Time series of average image-specific reinstatement across 6 LOC, 8 PAR, 8 PT, and 10 MTL participants during the recognition period. Dots indicate significant increases in image-specific reinstatement corrected for multiple comparisons (p < 0.05, permutation procedure; image appears at t = 0). All error bars indicate standard error of mean.

