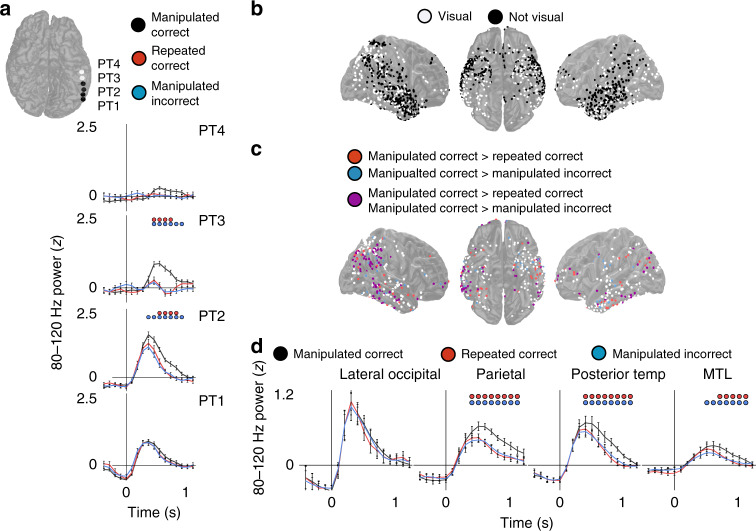
Fig. 3. Increases in 80–120 Hz power in visual association cortex and MTL reflect differences between present and remembered visual experience.
a Time series of 80–120 Hz power for a set of posterior temporal electrodes in an example participant during 142 manipulated correct (black), 122 manipulated incorrect (blue), and 82 repeated correct (red) recognition trials (200 ms sliding windows, 50% overlap; image appears at t = 0). Blue and red dots indicate significant differences in 80–120 Hz power between manipulated correct and manipulated incorrect and repeated correct condition, respectively (p < 0.05, permutation procedure). b All electrodes across all participants demonstrating significant increases in 80–120 Hz power from baseline (white; p < 0.05, permutation procedure corrected for multiple comparison within each electrode). c All visually responsive electrodes in each participant (white) demonstrating significant increases in 80–120 Hz power for the manipulated correct compared to the manipulated incorrect (blue), manipulated correct compared to the repeated correct (red), or both (purple; p < 0.05, permutation procedure corrected for multiple comparison within each electrode). d Time courses of 80–120 Hz power for the manipulated correct, manipulated incorrect, and repeated correct conditions across 6 LOC, 8 PAR, 10 PT, and 10 MTL participants during the recognition period (200 ms sliding windows, 50% overlap; image appears at t = 0). Blue and red dots indicate significant differences in 80–120 Hz power between manipulated correct and manipulated incorrect and repeated correct condition, respectively (p < 0.05, permutation procedure). All error bars indicate standard error of mean.

