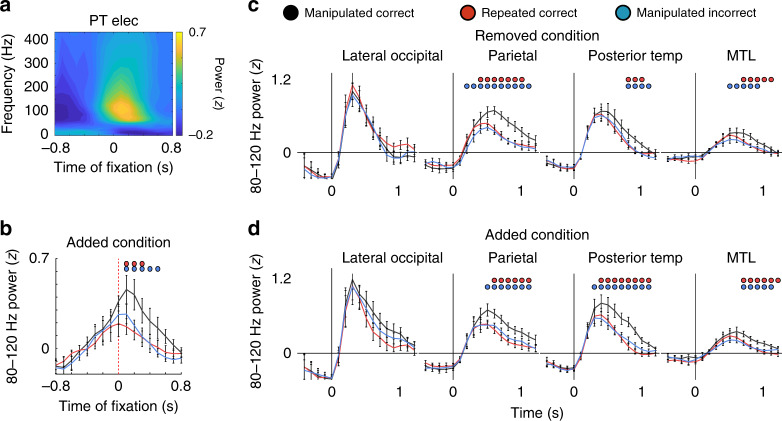
Fig. 4. Increases in 80–120 Hz power are locked to eye fixations and emerge whether an item is added or removed.
a Average spectrogram relative to the first fixation on successfully recognized added items for a representative electrode in PT. b Time courses of 80–120 Hz for visually responsive electrodes across participants for the added correct, added incorrect, and repeated correct conditions locked to the first fixation on the added item (200 ms sliding windows, 50% overlap; eye fixation at t = 0). Blue and red dots indicate significant differences in 80–120 Hz power between added correct and added incorrect and repeated correct condition across 8 participants, respectively (p < 0.05, permutation procedure). c Time courses of 80–120 Hz power for the removed correct, removed incorrect, and repeated conditions across 6 LOC, 8 PAR, 10 PT, and 10 MTL participants during the recognition period (200 ms sliding windows, 50% overlap; image appears at t = 0). Blue and red dots indicate significant differences in 80–120 Hz power between removed correct and removed incorrect and repeated correct condition, respectively (p < 0.05, permutation procedure). d Time courses of 80–120 Hz power for the added correct, added incorrect, and repeated conditions across 6 LOC, 8 PAR, 10 PT, and 10 MTL participants during the recognition period (200 ms sliding windows, 50% overlap; image appears at t = 0). Blue and red dots indicate significant differences in 80–120 Hz power between added correct and added incorrect and repeated correct condition, respectively (p < 0.05, permutation procedure). All error bars indicate standard error of mean.

