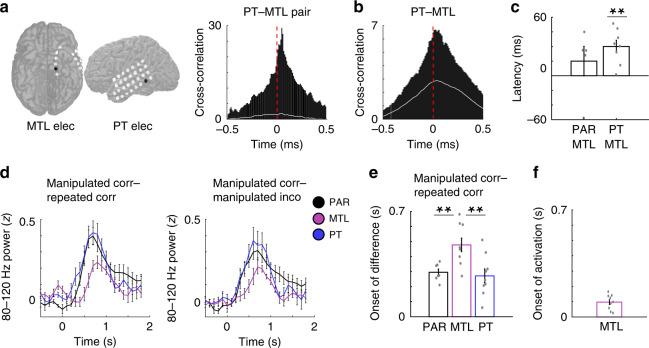
Fig. 5. Differences in 80–120 Hz power between present and remembered visual experience emerge in visual association cortex earlier than in the MTL.
a Representative cross-correlation of 80–120 Hz power between a PT and MTL electrode in an example participant. The chance cross-correlation for this electrode pair is indicated by the white line. b Average cross-correlation of 80–120 Hz power between the PT and MTL electrodes across participants. The chance cross-correlation for the average across all electrode pairs is indicated by the white line. c Average peak times (latency) of 80–120 Hz cross-correlograms for PT–MTL and PAR–MTL electrode pairs across participants. Average latency between PT and MTL electrodes across 8 participants was significantly greater than zero (t(7) = 4.78, p = 0.002, two-tailed paired t test). d Average time series of differences between the manipulated and repeated correct conditions (left) and manipulated correct and incorrect conditions (right) across 9 PT, 7 PAR, and 9 MTL participants (200 ms sliding windows, 50% overlap; image appears at t = 0). e Average estimated onset of differences in 80–120 Hz power between manipulated correct and repeated conditions in 9 PT, 7 PAR, and 9 MTL participants (left). The differences in 80–120 Hz power between manipulated correct and repeated conditions arose significantly earlier in PT and PAR compared to MTL (PT vs MTL, t(16) = −3.21, p = 0.005; PAR vs MTL, t(14) = −3.32, p = 0.005). Asterisks (**) indicate significance at p < 0.01; two-sided unpaired t test. f Average estimated onset of 80–120 Hz MTL power (activation) across 9 participants. All error bars indicate standard error of mean.

