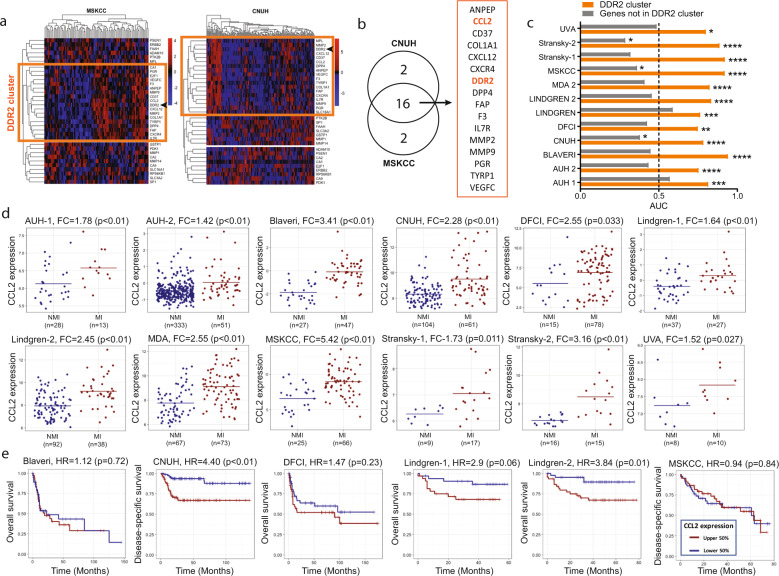
Fig. 1. Association of CCL2 expression with stage and outcome in bladder cancer.
a Unsupervised clustering of the genes from the functional genomics screen21 in MSKCC (n = 91 independent patient samples) and CNUH (n = 165 independent patient samples) cohorts identified three groups of highly correlated genes in each cohort. DDR2 was in one of these groups (orange boxes). b The overlap between the groups encompassing DDR2 in each cohort identified a 16 gene DDR2 consensus set (called “DDR2 cluster”). c Ability of the 16 gene DDR2 cluster score (average normalized expression of all cluster genes) to distinguish between patients with non-muscle invasive (NMI) and muscle-invasive (MI) tumors in 12 patient cohorts (n = 1257 independent patient samples). The length of each bar corresponds to the area under the receiver operating characteristic (ROC) curve (AUC), with AUC > 0.50 indicating a higher DDR2 cluster score in patients with MI tumors. Orange bar represents DDR2 cluster and gray bar represents all genes not in DDR2 cluster. Dotted line denotes AUC = 0.50, or what is expected by random chance. P values shown are calculated using the Wilcoxon rank-sum test. d Dot plots showing CCL2 expression in NMI and MI bladder tumors in 12 patient cohorts (n = 1257 independent patient samples). For each cohort, Fold Change (FC) and p values calculated by non-parametric Wilcoxon rank-sum test are reported. e Kaplan–Meier curves stratifying patients by high (red curves) and low (blue curves) CCL2 expression, relative to the median cut-point in six patient cohorts (n = 505 independent patient samples). Hazard ratios (HR) and log-rank p values are reported. Differential expression was evaluated using the non-parametric Wilcoxon rank-sum test to assess statistical significance. Survival analysis was carried out by generating Kaplan–Meier curves, reporting the hazard ratio (HR) and calculating p-values using the log-rank test by fitting cox proportional hazard models in R.

