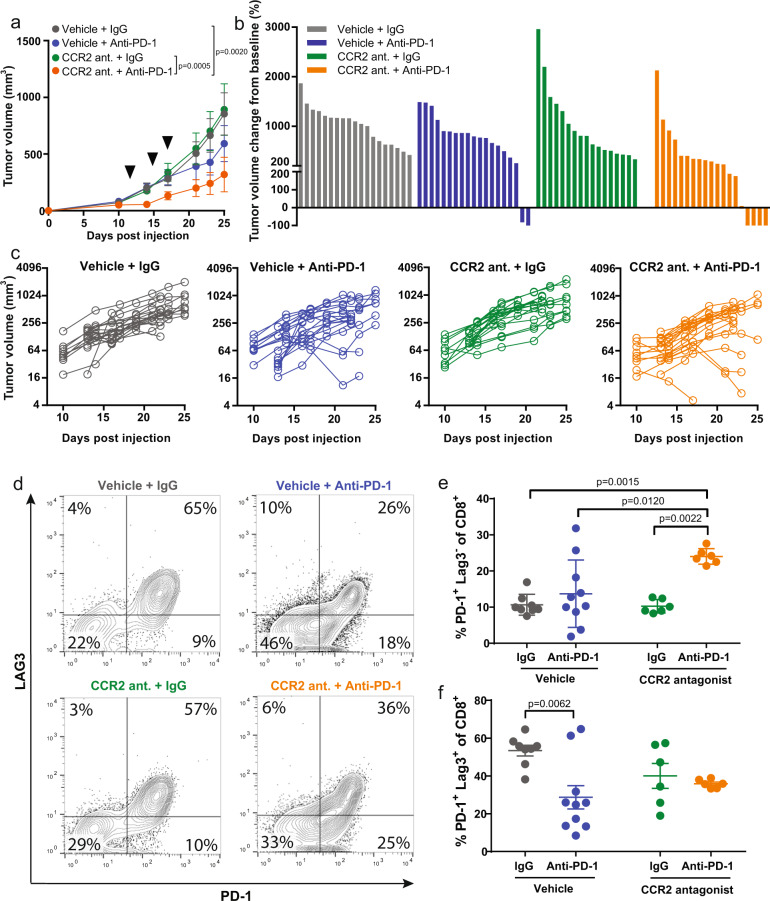
Fig. 4. Combination CCR2 antagonist RS504393 and anti-PD-1 suppresses mammary tumors.
a Mammary fat pad tumor growth in syngeneic mice injected with E0771 (n = 8 or 9 biologically independent mice per group). Data representative of three independent experiments. Arrows indicate dates in which anti-PD-1 treatment was given. b Waterfall plot showing change in E0771 tumor volume compared to baseline prior to treatment. c Individual tumor volume as a function of time. Each line represents a single mouse (n = 17 or 19 biologically independent mice per group). d Representative image of raw flow cytometry data looking at LAG3 and PD-1 expression on tumor-infiltrating CD8+ T cells. Percentage of (e) PD-1+ LAG3- and (f) PD-1+ LAG3+ of CD8+ T cells. Mean ± SD. Statistical significance was determined by two-way ANOVA. If statistical significance is not indicated in the figure, p > 0.05.

