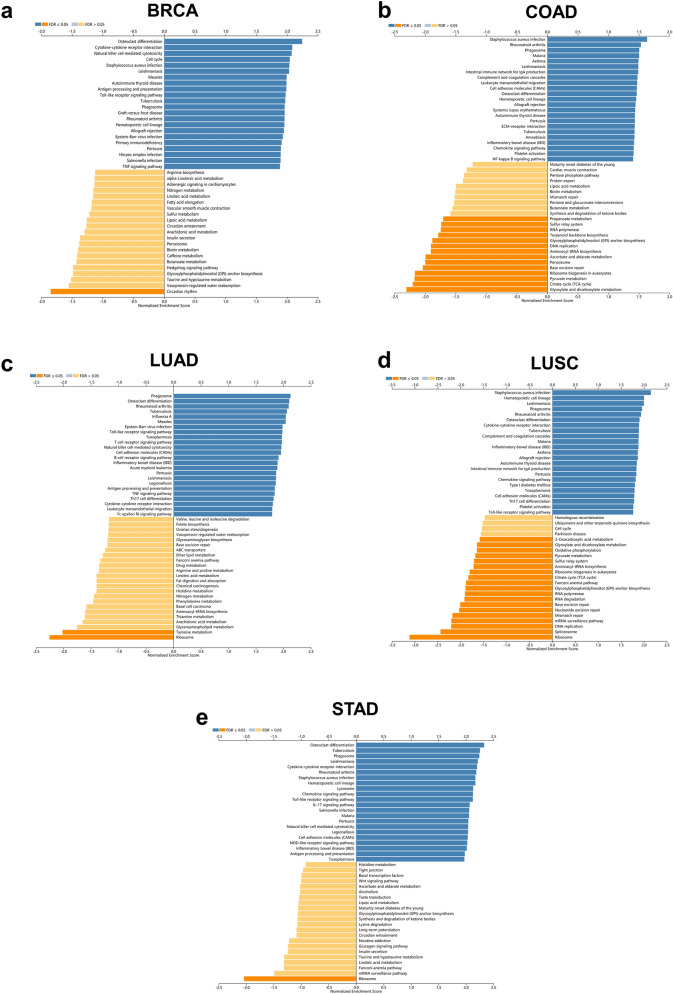
Figure 6.
KEGG analysis of genes differentially expressed in correlation with AQP9. (a) Breast invasive carcinoma (BRCA), (b) colon adenocarcinoma (COAD), (c) lung adenocarcinoma (LUAD), (d) lung squamous cell carcinoma (LUSC) and (e) stomach adenocarcinoma (STAD) in the LinkedOmics database. Dark blue and dark yellow represent KEGG pathways in which the normal enrichment score (NES) is positive or negative and with a significance of FDR < 0.05. Light blue and light yellow represent KEGG pathways with a significance of FDR > 0.05.

