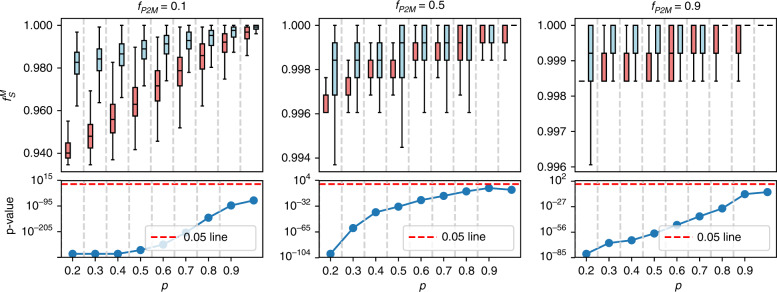
Fig. 3. Targeting dyslipidemia-related genes (red boxes) causes more damage to the metabolic network than degree-preserving random attacks (blue boxes).
(Top) The fraction of functional nodes after perturbations for several values of the remaining fraction ps of metabolic disease genes and threshold proportion fP2M (a metabolite fails if more than fP2M fraction of supporting proteins fail); (bottom) p values of the one-sided Mann–Whitney test between the distributions of the functional node-set sizes in the targeted and random case. Lower values indicate a higher degree of damage to the network. The result of each bar is calculated based on 1000 random realizations. For each distribution, boxes indicate the quartiles, whiskers extend to an additional 1.5 * IQR interval, and the medians are represented by a black line.

