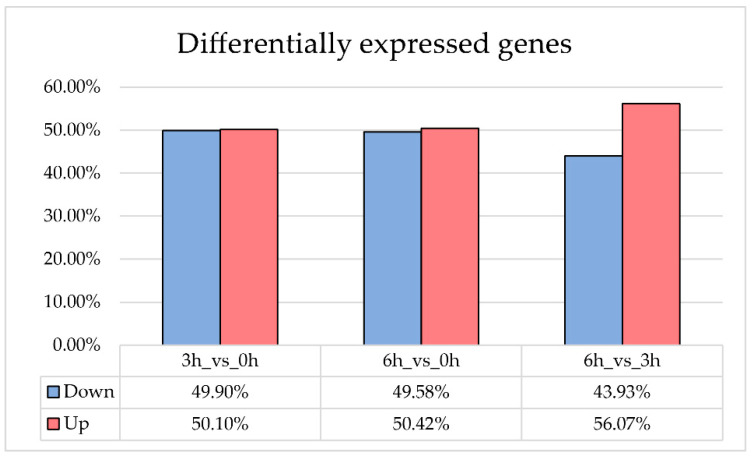
Figure 2.
Differentially Expressed Genes (DEGs) in A2E-treated RPE cells. The histogram shows DEGs detected in RPE cells treated with A2E when compared to untreated cultures. Values are expressed in percentage. For each time point considered, blue bars indicate the down-expressed genes, while red ones refer to up-regulated genes. Both A2E-treated cells and control H-RPE cells were exposed to a blue light period.

