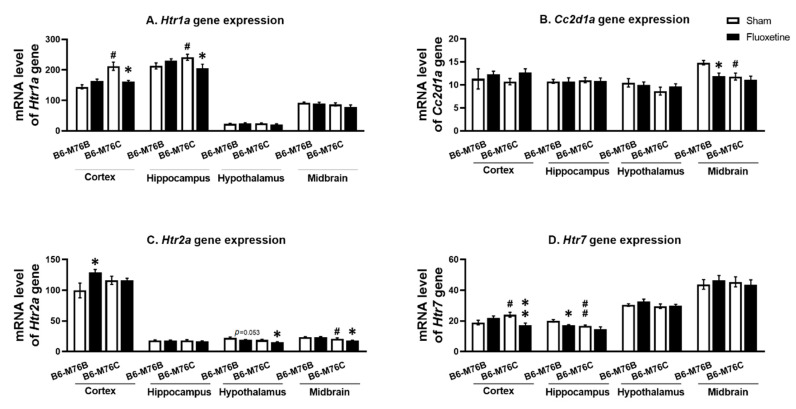
Figure 3.
Htr1a (A), Htr2a (C) and Htr7 (D) receptor and Cc2d1a (B) genes expression in the brain structures of control and chronically-treated-with-fluoxetine B6-M76C and B6-M76B mice. Gene expression is presented as the number of complementary DNA (cDNA) copies with respect to 100 cDNA copies of rPol2a, n ≥ 8 for each group. All values are presented as mean ± SEM. * p < 0.05, ** p < 0.01 compared to control mice of the same line, # p < 0.05, ## p < 0.01 compared to control B6-M76B mice.

