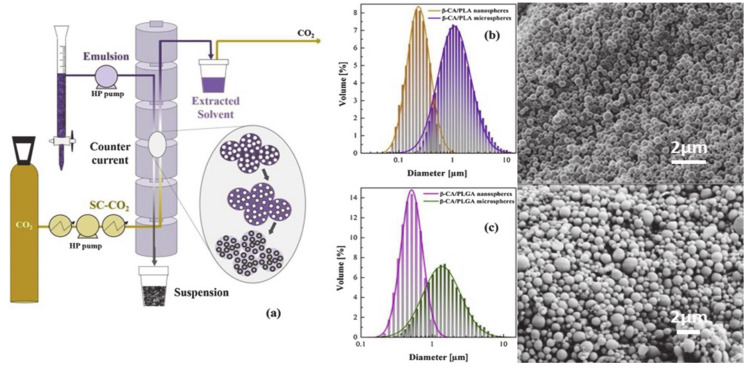
Figure 9.
Left side. Schematic representation of the SFEE process (a). Size distributions of PLA (b) and PLGA (c) particles showing the possibility of varying particle sizes by modification of the initial droplet size in the emulsion. Right side: SEM images of PLLA loaded particles obtained from the emulsion after application of the SFEE method. Reprinted with permission from [113], Elsevier, 2019.

