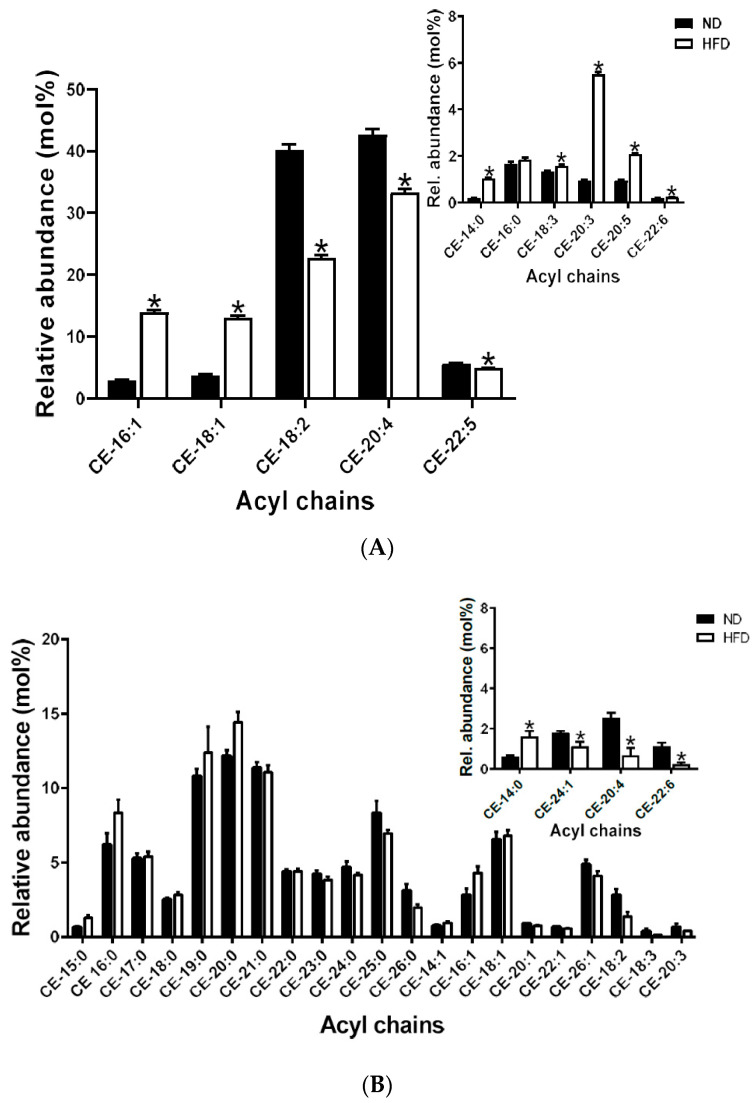
Figure 4.
(A) Plasma cholesteryl ester species detected; inset shows species with low relative abundance. Data are expressed as means ± SEM, * p < 0.05. Asterisks indicate a significant difference compared to the matched ND value. (B) Meibum cholesteryl ester species detected; inset shows species with low relative abundance. Data are expressed as means ± SEM, * p < 0.05. Asterisks indicate a significant difference compared to the matched ND value.

