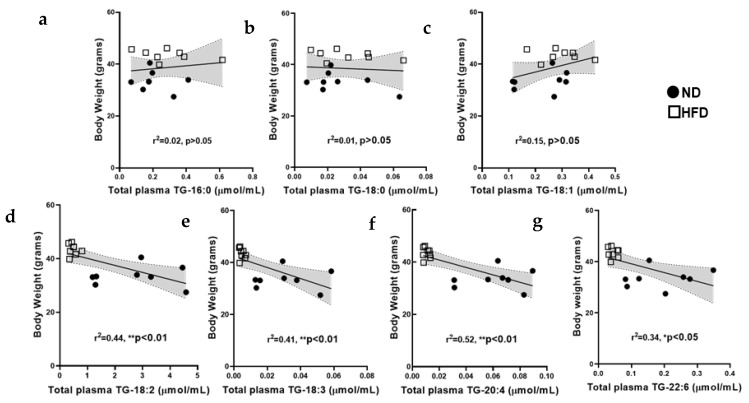
Figure A4.
Correlation between mouse body weight and total plasma (a) TG-16:0, (b) TG-18:0, (c) TG-18:1, (d) TG-18:2 (e) TG-18:3 (f) TG- 120:4 and (g) TG-22:6. The grey-shaded regions represent the 95% confidence interval. Asterisks indicate a significance difference compared to the matched ND value.

