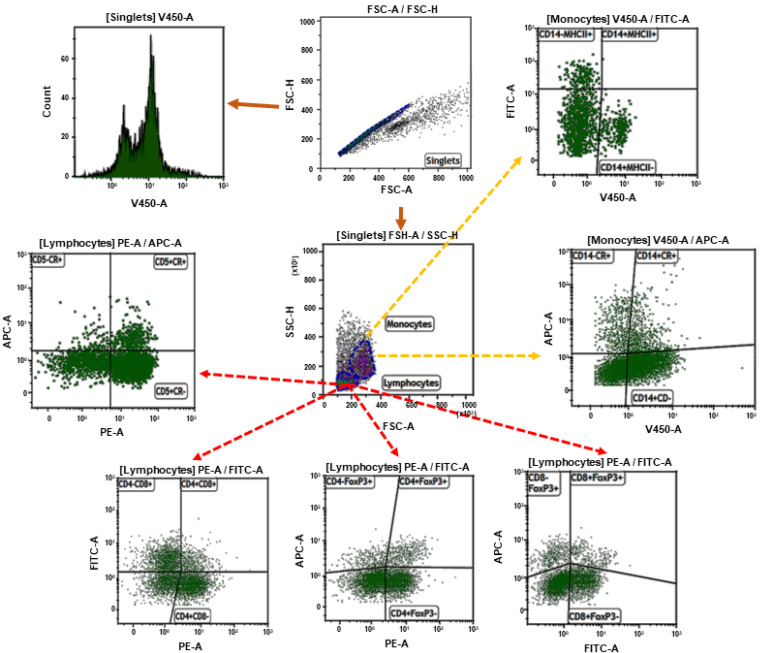
Figure 1.
The gating strategy. Doublets were removed from the analysis by setting the gate on single cells on the FSC-area (FSC-A) vs. FSC-high (FSC-H) dot plot. Cell proliferation was calculated from singlets. Next, the lymphocytes or monocytes were gated based on FSC and SSC dot plots. Then the gate included lymphocytes and analysis of CD4+, CD8+, and FoxP3 cells were made. The second sample included CD5+, CD14+, MHCII+ cells, and the median fluorescence intensity (MFI) of ROS was calculated on that cell population.

