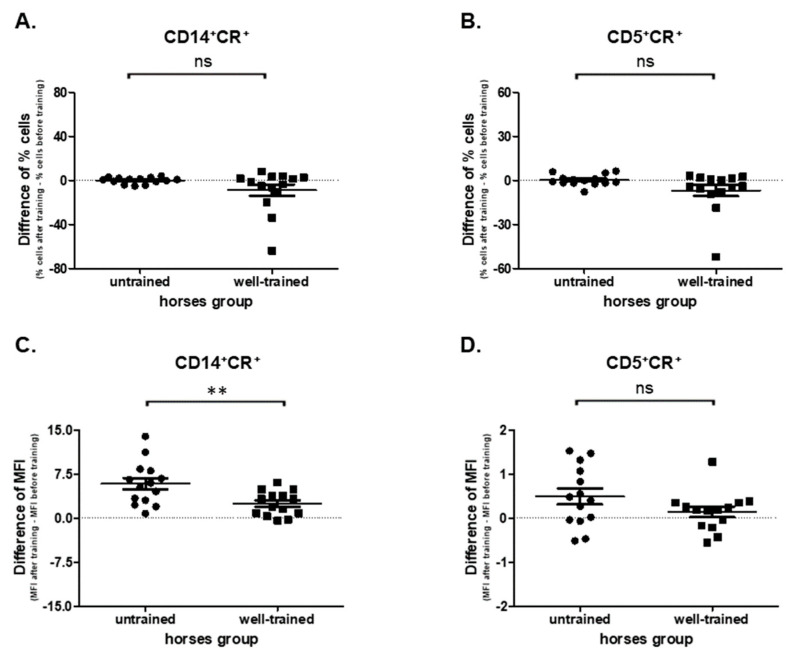
Figure 5.
Graphic representation showing percentages of positive cells: CD14+CR+ (A), CD5+CR+ (B), and CD14+MHCII+ gated from total lymphocytes/monocytes and median fluorescent intensity of CR (CellRox) in CD14+ (C) and CD5+ (D) cells. The results are presented as the mean ± SEM. Significance levels are: ** p < 0.01.

