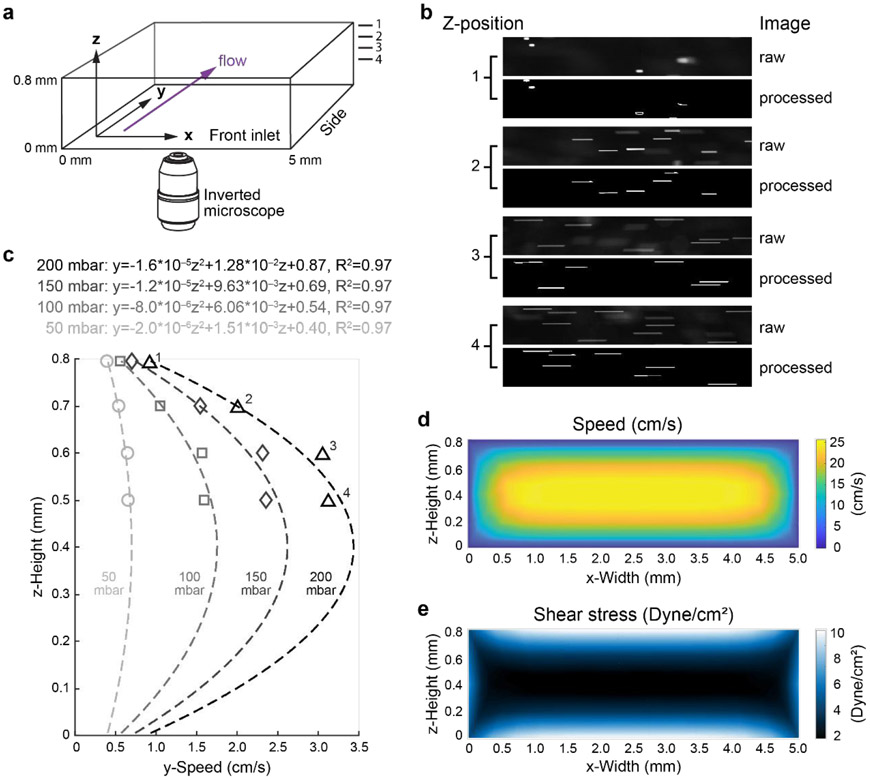
Figure 2. Fluorescent bead speed measurement and shear stress simulation.
(a) Schematic of ibidi μ-slide channel used for flowing bead streak measurement and shear stress simulation. Dimensions as labelled. Flow direction is indicated in purple arrow. Z-positions are 0.8 mm, 0.7 mm, 0.6 mm, and 0.5 mm for measurements labeled “1”, “2”, “3”, “4”. (b) Representative images of fluorescent bead streaks (raw and after image processing steps, or “processed”) from the z-positions 0.8 mm (“1”), 0.7 mm (“2”), 0.6 mm (“3”), and 0.5 mm (“4”) generated at 200 mbar pressure. (c) A custom algorithm was used to calculate the fluorescence bead speed at different channel z-positions (1-4). The height of the focal plane (in micrometers) within the flow channel is z. Pressures are indicated. Computational fluidic dynamic simulated flow speed (d) and shear stress (e) at 800 mbar output from Elveflow pump are presented in front view, respectively.

