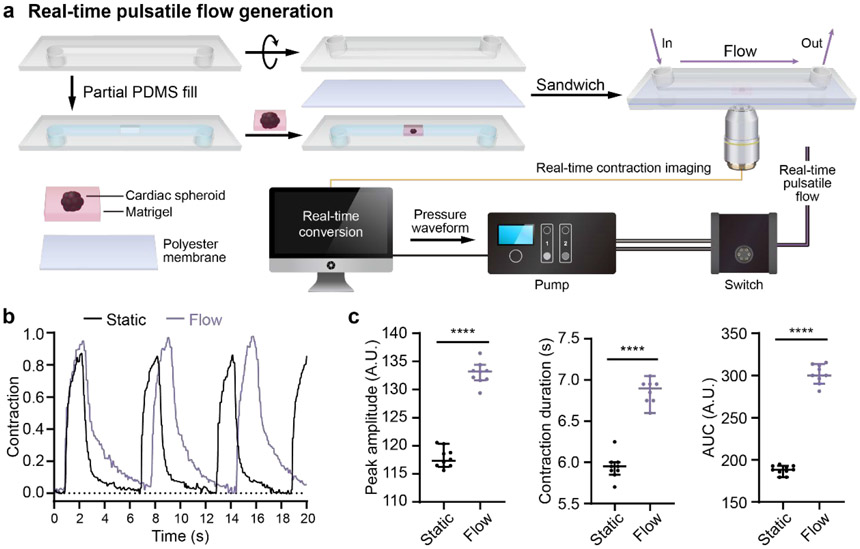
Figure 5. hPSC-CS contraction in response to fluidic mechanical stimulation.
(a) Schematic of heart-on-a-chip modeling CS contraction feedback in reponse to fluidic mechanic stimulation. CSs were embedded in Matrigel and plated into the microchannel of a 0.8 mm ibidi sticky μ-slide (lower chamber). The lower chamber was sealed with a polyester membrane and covered with another 0.8 mm ibidi sticky μ-slide (upper chamber). The upper chamber was filled with CS culture medium. For contractions under static condition, CSs were first imaged with brightfield microscopy before applying fluidic flow to the spheroids. For contraction response upon to fluidic mechanic stimulation, CSs were imaged and the contraction waveforms were analyzed simultaneously by a computer. The pulsatile flow signal was instantaneously sent to the pump and the fluidic flow was applied to the CSs. The spheroid contractions in response to pulsatile flow were recorded by brightfield microscopy. All signals were analyzed by a custom algorithm. (b) Representative spheroid contraction waveforms before and after fluidic flow stimulation. (c) The peak contraction amplitude, contraction duration, and area under curve (AUC) for the contractions are presented as means ± SEM. All the contraction waveforms were calculated from the individual contractions over 30 seconds. Statistical significance was determined by Student’s t test (two-tailed) between two groups. ****P< 0.0001.

