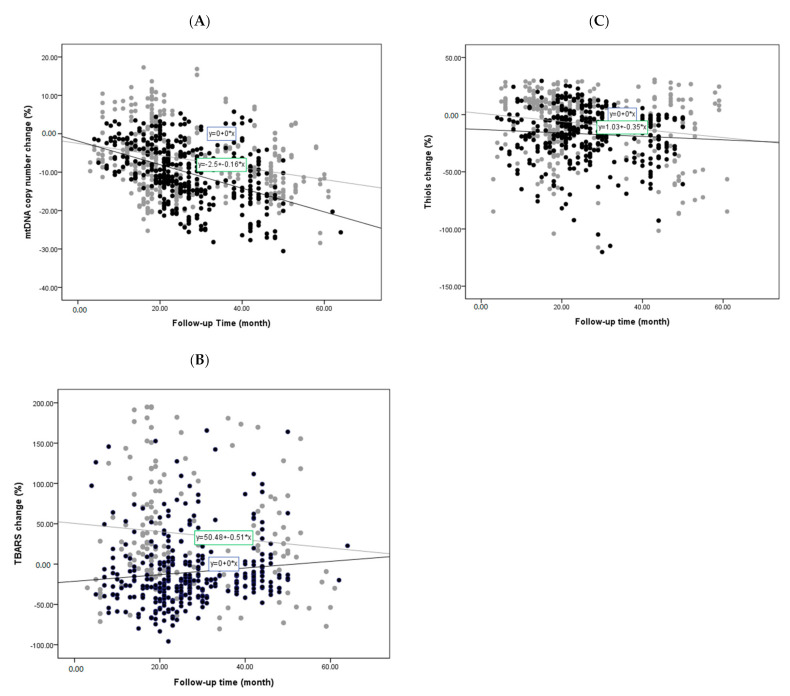
Figure 2.
Changes of oxidative stress markers and mtDNA copy number during follow-up studies of PD patients and non-PD controls: Simple scatter plots show changes of LogΔCt copy number (A), TBARS (B), and thiols (C) during follow-up studies of PD patients and non-PD controls. (● in (A–C) represents PD patient group; ● in (A–C) represents non-PD control group).

